Pivots By MoStAsHaR15
Download script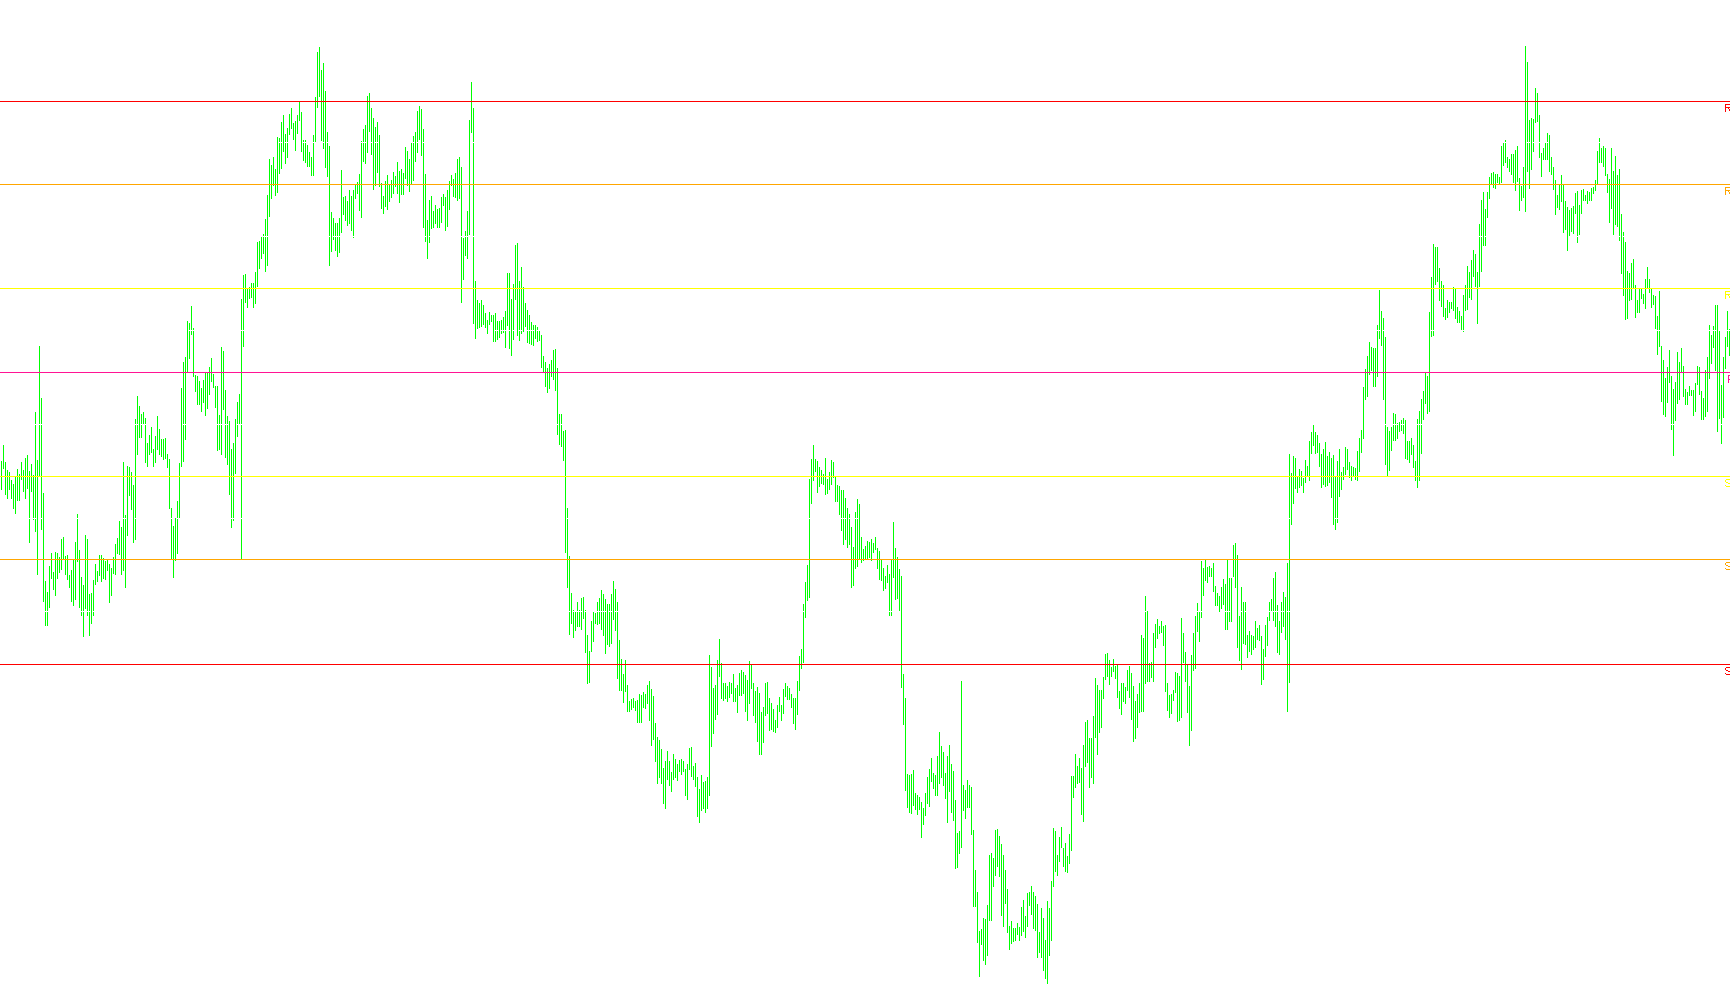
This script is designed for traders using the MetaTrader platform to identify key price levels based on historical market data. It automatically calculates and displays specific "Pivot Points" and "Camarilla Levels" directly on your trading chart, helping you visualize potential support and resistance zones.
Core Functionality
Data Analysis & Filtering The script begins by scanning the most recent historical price data. It specifically looks for high, low, and closing prices from the previous trading day. To ensure accuracy, it includes a safety check: if your current chart timeframe is set to anything larger than one day (such as a weekly or monthly view), the script will provide an error message and stop running, as these specific calculations require daily data to remain valid.
Automatic Calculations Once the previous day's data is identified, the script performs several mathematical operations to determine different levels:
- Pivot Points (P): This is the central equilibrium point, calculated using the average of the previous day's high, low, and closing prices.
- Resistance and Support Levels (R1, S1, R2, S3, etc.): Based on the central Pivot Point, the script projects multiple "levels" above (Resistance) and below (Support). These levels represent areas where the price may face pressure to turn around or potentially break through.
- Midpoints: The script further refines these zones by calculating midpoints between the major levels, providing more granular detail for traders looking for precise entry or exit points.
Visual Representation on Chart
To make this data easy to read at a glance, the script handles all the visual heavy lifting for you:
- Dynamic Line Drawing: The script automatically draws horizontal lines across your chart for every calculated level. Each level is assigned a specific color and style (such as solid lines or dashed lines) to differentiate them easily.
- Deep Pink: Central Pivot Point
- Red/Orange/Yellow: Primary Resistance and Support levels
- White (Dashed): Refined Midpoint levels
- Real-Time Labeling: Next to each horizontal line, the script places a text label (e.g., "R1", "S2", "P"). These labels move dynamically with the price, ensuring you always know exactly which level you are looking at without having to hover over the lines.
- Automatic Updates: The script is designed to refresh these lines automatically, keeping your chart updated with the most relevant levels as new data becomes available.
//+------------------------------------------------------------------+
//|                         Camarilla & Pivots                       |
//|                                                                  |
//|                                                   By MoStAsHaR15 |
//+------------------------------------------------------------------+
#property copyright "MoStAsHaR15 © 2005"
#property link      "http://www.mostashar15.com"

#property indicator_chart_window
//---- input parameters
extern int       GMTshift=2;
//+------------------------------------------------------------------+
//| Custom indicator initialization function                         |
//+------------------------------------------------------------------+
int init()
  {
//---- indicators
//----
   return(0);
  }
//+------------------------------------------------------------------+
//| Custor indicator deinitialization function                       |
//+------------------------------------------------------------------+
int deinit()
  {
//---- TODO: add your code here

//----
   return(0);
  }
//+------------------------------------------------------------------+
//| Custom indicator iteration function                              |
//+------------------------------------------------------------------+
int start()
  {
   int    counted_bars=IndicatorCounted();
//---- TODO: add your code here
double day_high=0;
double day_low=0;
double yesterday_high=0;
double yesterday_open=0;
double yesterday_low=0;
double yesterday_close=0;
double today_open=0;

double P=0,S=0,R=0,S1=0,R1=0,S2=0,R2=0,S3=0,R3=0,nQ=0,nD=0,D=0;
double H3,H2,H1,L1,L2,L3;
int cnt=720;
double cur_day=0;
double prev_day=0;

double rates_d1[2][6];

//---- exit if period is greater than daily charts
if(Period() > 1440)
{
Print("Error - Chart period is greater than 1 day.");
return(-1); // then exit
}

//---- Get new daily prices & calculate pivots

while (cnt!= 0)
{
	cur_day = TimeDay(Time[cnt]- (GMTshift*3600));

	if (prev_day != cur_day)
	{
		yesterday_close = Close[cnt+1];
		today_open = Open[cnt];
		yesterday_high = day_high;
		yesterday_low = day_low;

		day_high = High[cnt];
		day_low  = Low[cnt];

		prev_day = cur_day;
	}

   if (High[cnt]>day_high)
   {
      day_high = High[cnt];
   }
   if (Low[cnt]<day_low)
   {
      day_low = Low[cnt];
   }

//	SetIndexValue(cnt, 0);
	cnt--;

}

//------ Pivot Points ------

P = (yesterday_high + yesterday_low + yesterday_close)/3;
R1 = (2*P)-yesterday_low;
S1 = (2*P)-yesterday_high;
R2 = P-S1+R1;
S2 = P-R1+S1;
R3 = (2*P)+(yesterday_high-(2*yesterday_low));
S3 = (2*P)-((2* yesterday_high)-yesterday_low);

//------ Midpoints ------

H3 = (S2+S3)/2;
H2 = (S1+S2)/2;
H1 = (P+S1)/2;
L1 = (P+R1)/2;
L2 = (R1+R2)/2;
L3 = (R2+R3)/2;
//H3 = yesterday_high / yesterday_low * yesterday_close;
//H2 = (((yesterday_high/yesterday_low)+0.83)/1.83 )* yesterday_close;
//H1 = (((yesterday_high/yesterday_low)+2.66)/3.66 )* yesterday_close;
//L1 = yesterday_close - (H1-yesterday_close);
//L2 = yesterday_close - (H2-yesterday_close);
//L3 = yesterday_close - (H3-yesterday_close);

//------ DRAWING LINES ------

Comment("Camarilla Levels by MoStAsHaR15");

ObjectDelete("P_Line");

ObjectDelete("S3_Line");
ObjectDelete("R3_Line");

ObjectDelete("S2_Line");
ObjectDelete("R2_Line");

ObjectDelete("S1_Line");
ObjectDelete("R1_Line");

ObjectDelete("H3_Line");
ObjectDelete("L3_Line");

ObjectDelete("H2_Line");
ObjectDelete("L2_Line");

ObjectDelete("H1_Line");
ObjectDelete("L1_Line");

ObjectCreate("P_Line", OBJ_HLINE,0, CurTime(),P);
ObjectSet("P_Line",OBJPROP_COLOR,DeepPink);
ObjectSet("P_Line",OBJPROP_STYLE,STYLE_SOLID);

ObjectCreate("S3_Line", OBJ_HLINE,0, CurTime(),S3);
ObjectSet("S3_Line",OBJPROP_COLOR,Red);
ObjectSet("S3_Line",OBJPROP_STYLE,STYLE_SOLID);

ObjectCreate("R3_Line", OBJ_HLINE,0, CurTime(),R3);
ObjectSet("R3_Line",OBJPROP_COLOR,Red);
ObjectSet("R3_Line",OBJPROP_STYLE,STYLE_SOLID);

ObjectCreate("S2_Line", OBJ_HLINE,0, CurTime(),S2);
ObjectSet("S2_Line",OBJPROP_COLOR,Orange);
ObjectSet("S2_Line",OBJPROP_STYLE,STYLE_SOLID);

ObjectCreate("R2_Line", OBJ_HLINE,0, CurTime(),R2);
ObjectSet("R2_Line",OBJPROP_COLOR,Orange);
ObjectSet("R2_Line",OBJPROP_STYLE,STYLE_SOLID);

ObjectCreate("S1_Line", OBJ_HLINE,0, CurTime(),S1);
ObjectSet("S1_Line",OBJPROP_COLOR,Yellow);
ObjectSet("S1_Line",OBJPROP_STYLE,STYLE_SOLID);

ObjectCreate("R1_Line", OBJ_HLINE,0, CurTime(),R1);
ObjectSet("R1_Line",OBJPROP_COLOR,Yellow);
ObjectSet("R1_Line",OBJPROP_STYLE,STYLE_SOLID);

ObjectCreate("H3_Line", OBJ_HLINE,0, CurTime(),H3);
ObjectSet("H3_Line",OBJPROP_COLOR,White);
ObjectSet("H3_Line",OBJPROP_STYLE,STYLE_DASHDOTDOT);

ObjectCreate("H2_Line", OBJ_HLINE,0, CurTime(),H2);
ObjectSet("H2_Line",OBJPROP_COLOR,White);
ObjectSet("H2_Line",OBJPROP_STYLE,STYLE_DASHDOTDOT);

ObjectCreate("H1_Line", OBJ_HLINE,0, CurTime(),H1);
ObjectSet("H1_Line",OBJPROP_COLOR,White);
ObjectSet("H1_Line",OBJPROP_STYLE,STYLE_DASHDOTDOT);

ObjectCreate("L1_Line", OBJ_HLINE,0, CurTime(),L1);
ObjectSet("L1_Line",OBJPROP_COLOR,White);
ObjectSet("L1_Line",OBJPROP_STYLE,STYLE_DASHDOTDOT);

ObjectCreate("L2_Line", OBJ_HLINE,0, CurTime(),L2);
ObjectSet("L2_Line",OBJPROP_COLOR,White);
ObjectSet("L2_Line",OBJPROP_STYLE,STYLE_DASHDOTDOT);

ObjectCreate("L3_Line", OBJ_HLINE,0, CurTime(),L3);
ObjectSet("L3_Line",OBJPROP_COLOR,White);
ObjectSet("L3_Line",OBJPROP_STYLE,STYLE_DASHDOTDOT);

ObjectsRedraw();

// --- Typing Labels

if(ObjectFind("R3 label") != 0)
{
ObjectCreate("R3 label", OBJ_TEXT, 0, Time[0], R3);
ObjectSetText("R3 label", " R3 ", 8, "Arial", Red);
}
else
{
ObjectMove("R3 label", 0, Time[0], R3);
}

if(ObjectFind("S3 label") != 0)
{
ObjectCreate("S3 label", OBJ_TEXT, 0, Time[0], S3);
ObjectSetText("S3 label", " S3 ", 8, "Arial", Red);
}
else
{
ObjectMove("S3 label", 0, Time[0], S3);
}

if(ObjectFind("R2 label") != 0)
{
ObjectCreate("R2 label", OBJ_TEXT, 0, Time[0], R2);
ObjectSetText("R2 label", " R2 ", 8, "Arial", Orange);
}
else
{
ObjectMove("R2 label", 0, Time[0], R2);
}

 if(ObjectFind("S2 label") != 0)
{
ObjectCreate("S2 label", OBJ_TEXT, 0, Time[0], S2);
ObjectSetText("S2 label", " S2 ", 8, "Arial", Orange);
}
else
{
ObjectMove("S2 label", 0, Time[0], S2);
}

 if(ObjectFind("R1 label") != 0)
{
ObjectCreate("R1 label", OBJ_TEXT, 0, Time[0], R1);
ObjectSetText("R1 label", " R1 ", 8, "Arial", Yellow);
}
else
{
ObjectMove("R1 label", 0, Time[0], R1);
}

 if(ObjectFind("S1 label") != 0)
{
ObjectCreate("S1 label", OBJ_TEXT, 0, Time[0], S1);
ObjectSetText("S1 label", " S1 ", 8, "Arial", Yellow);
}
else
{
ObjectMove("S1 label", 0, Time[0], S1);
}

 if(ObjectFind("P label") != 0)
{
ObjectCreate("P label", OBJ_TEXT, 0, Time[0], P);
ObjectSetText("P label", " P ", 8, "Arial", DeepPink);
}
else
{
ObjectMove("P label", 0, Time[0], P);
}
   return(0);
 }
//+------------------------------------------------------------------+
Comments