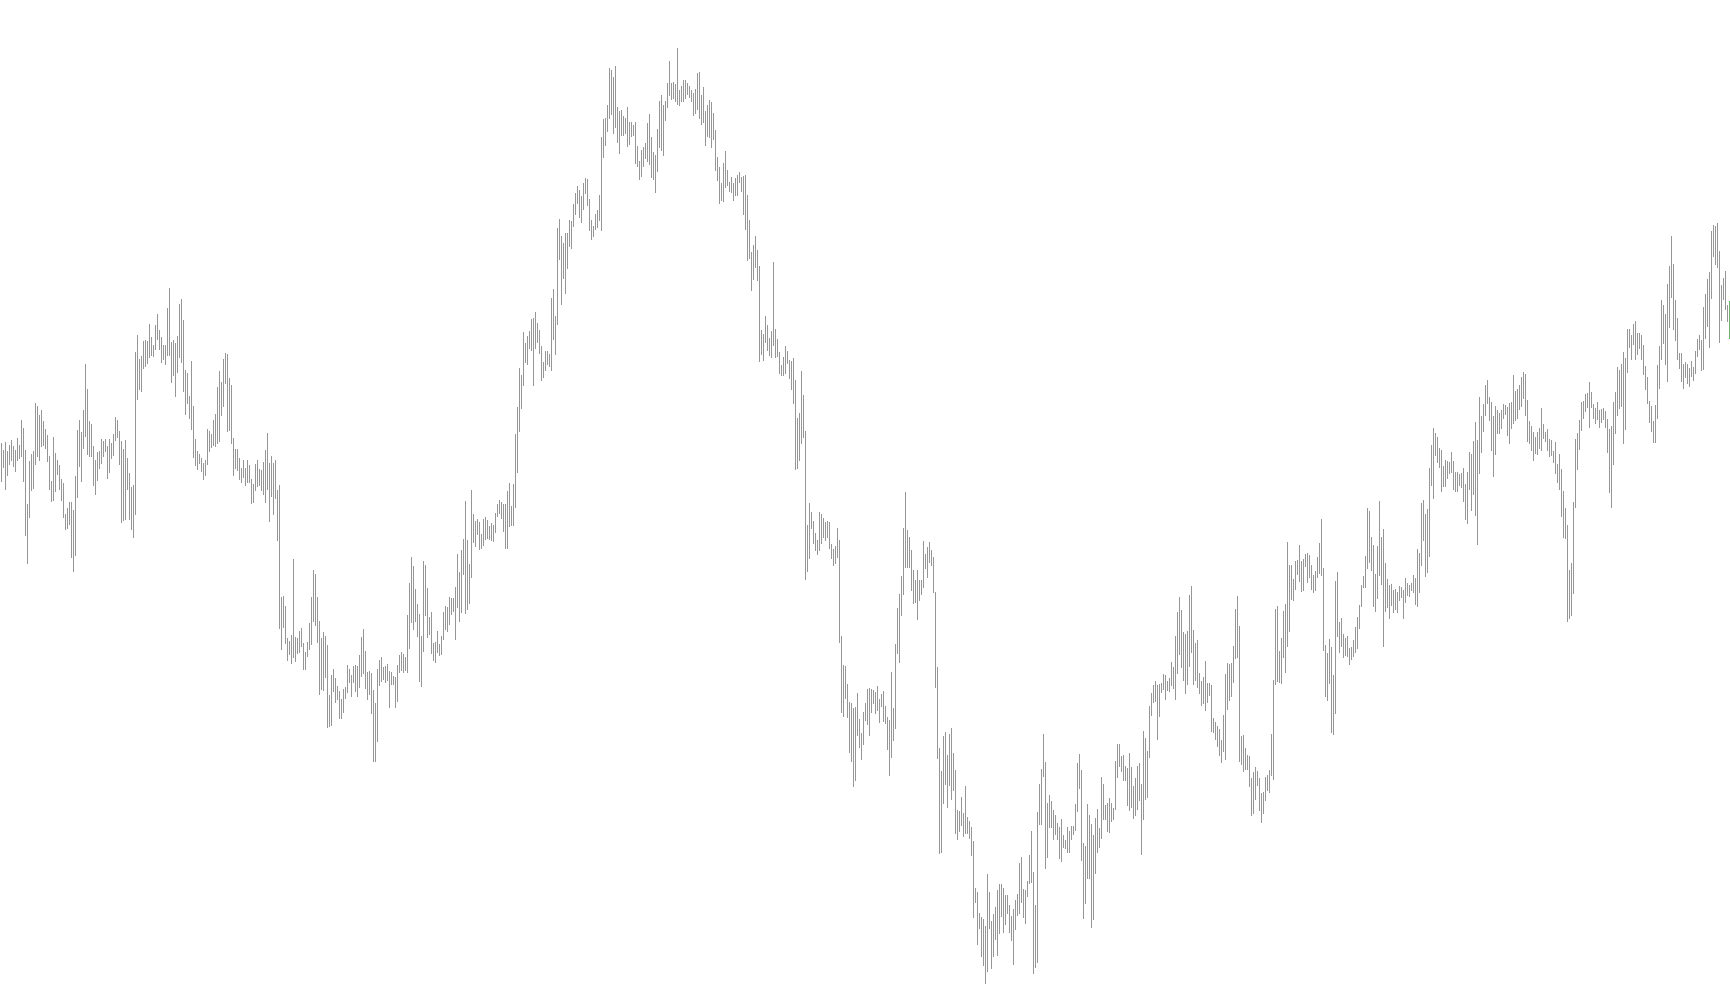
This indicator is designed to provide traders with a visual representation of price deviation by comparing current market extremes against their historical averages. It functions by isolating the "High" and "Low" price points of the market and measuring how far they have stretched away from a calculated moving average.
Core Logic Breakdown
1. Establishing the Baseline (The Moving Averages) The tool first calculates two distinct baseline averages based on a user-defined time period (defaulting to 15 bars).
- One average tracks the historical Highs of the candles.
- One average tracks the historical Lows of the candles.
By using these moving averages, the script creates a "smoothed" representation of where the price typically sits during normal market behavior.
2. Measuring Extreme Deviations Instead of simply showing the current price, the indicator looks at the relationship between the actual current high/low and the historical average identified in the previous step.
The logic employs a mathematical power calculation (raising both the current price and the average to the 5th power) before dividing them. In non-technical terms, this serves to amplify the variance. It makes small discrepancies between the price and its average less visible, while significantly highlighting large, "overextended" movements.
3. Visual Output The result is plotted as two separate lines on a dedicated sub-window:
- High Deviation: Shows how aggressively the price is pushing toward the upper limits relative to its recent history.
- Low Deviation: Shows how aggressively the price is pulling toward the lower limits relative to its recent history.
Practical Application for Traders
The primary goal of this logic is to identify overextended markets. When the lines on the indicator move significantly away from the center, it suggests that the market may be overbought or oversold. By looking at these amplified deviations, traders can better identify potential exhaustion points where a price correction might be likely to occur, as the current price has moved disproportionately far from its established average.
//+------------------------------------------------------------------+
//|                 This has been coded by MT-Coder                  |
//|                                                                  |
//|                     Email: mt-coder@hotmail.com                  |
//|                      Website: mt-coder.110mb.com                 |
//|                                                                  |
//| For a price I can code for you any strategy you have in mind     |
//|            into EA, I can code any indicator you have in mind    |
//|                                                                  |
//|          Don't hesitate to contact me at mt-coder@hotmail.com    |
//+------------------------------------------------------------------+


#property copyright "Copyright © 2009, MT-Coder."
#property link      "http://mt-coder.110mb.com/"

#property indicator_separate_window
#property indicator_buffers 2
#property indicator_color1 Blue
#property indicator_color2 Red

//---- input parameters
extern int IndPeriod=15;
//---- buffers
double HighBuffer[];
double LowBuffer[];
double TempHighBuffer[];
double TempLowBuffer[];

//+------------------------------------------------------------------+
//| Custom indicator initialization function                         |
//+------------------------------------------------------------------+
int init()
  {
   string short_name;
   //---- additional buffers used for counting.
   IndicatorBuffers(4);
   IndicatorDigits(Digits);
//---- indicator line
   SetIndexStyle(0,DRAW_LINE);
   SetIndexBuffer(0,HighBuffer);
   SetIndexStyle(1,DRAW_LINE);
   SetIndexBuffer(1,LowBuffer);
   SetIndexBuffer(2,TempHighBuffer);
   SetIndexBuffer(3,TempLowBuffer);


//---- name for DataWindow and indicator subwindow label
   short_name="Average Change_Low n High - by MT-Coder("+IndPeriod+")";
   IndicatorShortName(short_name);
   SetIndexLabel(0,"AC High");
   SetIndexLabel(1,"AC Low");

//----
   SetIndexDrawBegin(0,IndPeriod);
   SetIndexDrawBegin(1,IndPeriod);

//----
   return(0);
  }
//+------------------------------------------------------------------+
//| FAC low n high                                                   |
//+------------------------------------------------------------------+
int start()
  {
   int i,counted_bars=IndicatorCounted();
//----
   if(Bars<=IndPeriod) return(0);
//---- initial zero
   if(counted_bars<1)
     // for(i=1;i<=IndPeriod;i++) MomBuffer[Bars-i]=0.0;
//----
//----
   int limit=Bars-counted_bars;
   if(counted_bars>0) limit++;
   for(i=0; i<limit; i++)
      TempHighBuffer[i]=iMA(NULL,0,IndPeriod,0,MODE_SMA,PRICE_HIGH,i);

   int limito=Bars-counted_bars;
   if(counted_bars>0) limito++;
   for(i=0; i<limito; i++)

      TempLowBuffer[i]=iMA(NULL,0,IndPeriod,0,MODE_SMA,PRICE_LOW,i);

//----
   i=Bars-IndPeriod-1;
   if(counted_bars>=IndPeriod) i=Bars-counted_bars-1;
   while(i>=0)
     {


      HighBuffer[i]=MathPow(High[i],5)/MathPow(TempHighBuffer[i],5);

      LowBuffer[i]=MathPow(Low[i],5)/MathPow(TempLowBuffer[i],5);


      i--;
     }
   return(0);
  }
//+------------------------------------------------------------------+
Comments