EMA_Trend_Indicator_v2
Download script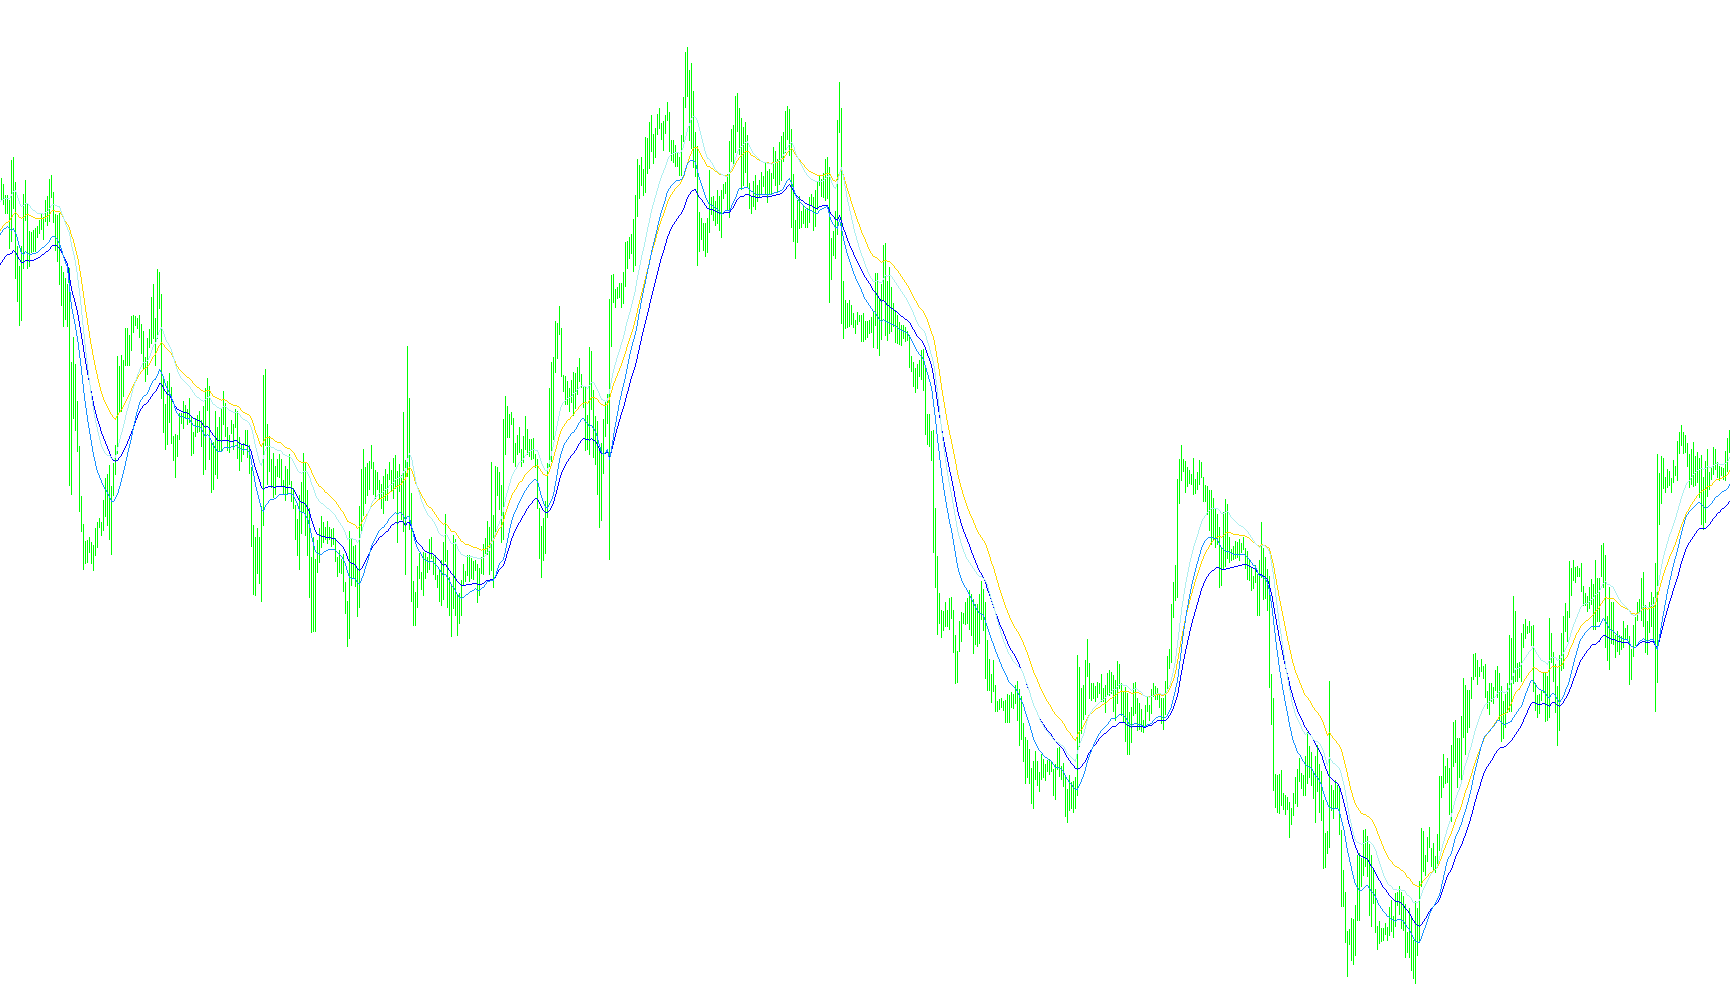
This indicator is designed to help traders visualize and identify prevailing market trends by analyzing price movements through the lens of moving averages. Rather than looking at a single price point, the tool smooths out market "noise" to reveal the underlying direction of the asset.
How the Logic Works
The script functions by calculating four distinct moving average lines simultaneously on your chart. These are categorized into two pairs: a Fast set and a Slow set. Each pair tracks different extremes of the price action:
- High Price Tracking: One set of lines monitors the "highs" (the upper boundaries) of the price candles.
- Low Price Tracking: The second set of lines monitors the "lows" (the lower boundaries) of the price candles.
By separating the high and low data points, the indicator provides a more comprehensive view of the price range than a standard moving average would offer.
Key Components of the Logic
-
Speed Dynamics (Fast vs. Slow):
- The Fast Moving Average uses a shorter time frame (defaulting to 21 periods). This reacts more quickly to recent price changes, making it useful for identifying immediate momentum.
- The Slow Moving Average uses a longer time frame (defaulting to 34 periods). This represents the broader, long-term trend and acts as a stabilizer against temporary price fluctuations.
-
Trend Visualization: By plotting these four lines, the indicator creates a visual "envelope" or channel of price activity. Traders can use the relationship between these lines to gauge market sentiment:
- When the Fast lines move significantly above or below the Slow lines, it often signals an increase in momentum.
- The distance and orientation between the High and Low averages help traders see if the price is expanding (high volatility) or contracting (consolidation).
Summary for the User
Essentially, this tool transforms raw price data into a structured visual map. It allows you to see not just where the price is currently sitting, but how the "ceiling" (highs) and "floor" (lows) of the market are moving over time relative to each other. This helps in identifying whether the market is trending upward, downward, or moving sideways.
//+------------------------------------------------------------------+
//|                                          EMA_Trend_Indicator.mq4 |
//|                                Copyright © 2006, Robert L Hill   |
//+------------------------------------------------------------------+
// Uses an idea from david to use EMAs to determine trend
#property copyright "Copyright © 2005, Metaquotes"
#property link      "mailto:metaquotes@metaquotes.net"

#property indicator_chart_window
#property indicator_buffers 4
#property indicator_color1 Blue
#property indicator_color2 Red
#property indicator_color3 Magenta
#property indicator_color4 DodgerBlue
#property indicator_width1 1
#property indicator_width2 1
#property indicator_width3 1
#property indicator_width4 1
//---- input parameters
extern int FastMAPeriod=21;
extern int SlowMAPeriod=34;
//---- buffers
double fastEMA_HighBuffer[];
double fastEMA_LowBuffer[];
double slowEMA_HighBuffer[];
double slowEMA_LowBuffer[];
//+------------------------------------------------------------------+
//| Custom indicator initialization function                         |
//+------------------------------------------------------------------+
int init()
  {
   IndicatorDigits(MarketInfo(Symbol(), MODE_DIGITS) + 1);
   //---- indicators
   SetIndexStyle(0, DRAW_LINE);
   SetIndexBuffer(0, slowEMA_HighBuffer);
   SetIndexStyle(1, DRAW_LINE);
   SetIndexBuffer(1, slowEMA_LowBuffer);
   SetIndexStyle(2, DRAW_LINE);
   SetIndexBuffer(2, fastEMA_HighBuffer);
   SetIndexStyle(3, DRAW_LINE);
   SetIndexBuffer(3, fastEMA_LowBuffer);
   SetIndexDrawBegin(0, SlowMAPeriod);
   //---- name for DataWindow and indicator subwindow label
   IndicatorShortName("MA Trend ");
   //----
   return(0);
  }
//+------------------------------------------------------------------+
//| Custor indicator deinitialization function                       |
//+------------------------------------------------------------------+
int deinit()
  {
   //----
   return(0);
  }
//+------------------------------------------------------------------+
//| Custom indicator iteration function                              |
//+------------------------------------------------------------------+
int start()
  {
   int limit;
   int counted_bars = IndicatorCounted();
//---- check for possible errors
   if(counted_bars < 0)
       return(-1);
//---- last counted bar will be recounted
   if(counted_bars > 0)
       counted_bars--;
   limit = Bars - counted_bars;
//----
   for(int i = limit; i >= 0; i--)
     {
       fastEMA_HighBuffer[i] = iMA(NULL, 0, FastMAPeriod, 0, MODE_EMA, PRICE_HIGH, i);
       fastEMA_LowBuffer[i] = iMA(NULL, 0, FastMAPeriod, 0, MODE_EMA, PRICE_LOW, i);
       slowEMA_HighBuffer[i] = iMA(NULL, 0, SlowMAPeriod, 0, MODE_EMA, PRICE_HIGH, i);
       slowEMA_LowBuffer[i] = iMA(NULL, 0, SlowMAPeriod, 0, MODE_EMA, PRICE_LOW, i);
     }
//----
   return(0);
  }
//+------------------------------------------------------------------+
Comments