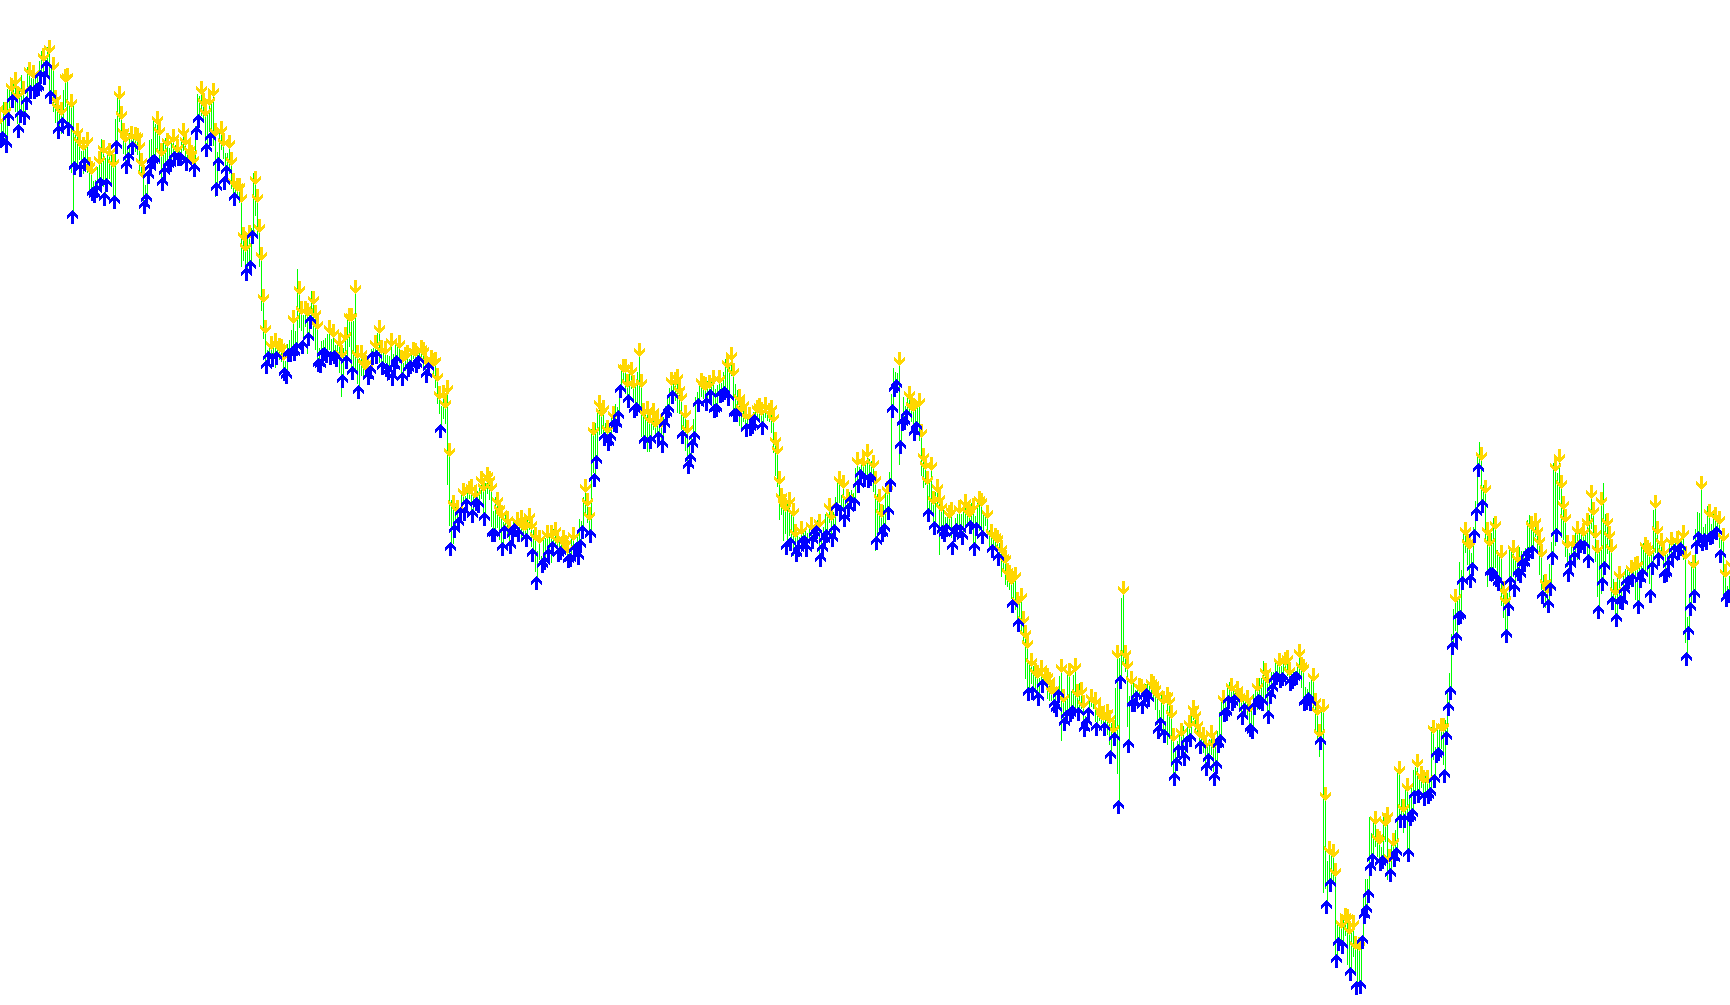
This indicator is designed to provide visual cues on a trading chart by identifying specific price action patterns based on the relationship between a candle's opening and closing prices. Its primary goal is to highlight potential reversal or momentum points by labeling them with distinct arrows.
Core Logic Overview
The script scans the historical data of the market (specifically looking back over the last 100 candles) to determine if a candle meets specific criteria for "selling" or "buying" pressure. It processes these candles one by one, starting from the oldest and moving toward the most recent price action.
How it Identifies Signals
The logic evaluates every candle based on two main factors: direction and size.
-
Selling Signals (Red Arrows): The script looks for "bearish" candles—those where the price closed lower than it opened. However, simply closing lower isn't enough; the candle must also meet a minimum size requirement defined by the user. If a candle is bearish and its body is larger than the specified threshold, the script marks that point on the chart with a red arrow positioned slightly above the candle's high price.
-
Buying Signals (Blue Arrows): Conversely, the script looks for "bullish" candles—those where the price closed higher than it opened. Again, it checks to see if the body of this candle exceeds the minimum size requirement. If a bullish candle is sufficiently large, the script marks that point with a blue arrow positioned slightly below the candle's low price.
Visual Presentation
Instead of drawing continuous lines or complex histograms, this tool uses specific symbols:
- Red Arrows: Act as visual markers for downward price movement.
- Blue Arrows: Act as visual markers for upward price movement.
The script ensures that these markers are placed clearly so they do not overlap with the actual price bars, maintaining a clean and readable chart for the trader. By filtering out small candles and only highlighting those with significant "bodies," the indicator attempts to filter out market noise and focus on more substantial price movements.
//+------------------------------------------------------------------+
//|                                                      BarsC-O.mq4 |
//|                                                                  |
//|                                                       Êâàíò      |
//+------------------------------------------------------------------+

#property copyright "Copyright © 2006"
#property link      "Kvant"

#property indicator_chart_window
#property indicator_color1 Red
#property indicator_buffers 2
#property indicator_color2 Blue

//+------------------------------------------------------------------+
//| Common External variables                                        |
//+------------------------------------------------------------------+
extern int body         = 0;
//+------------------------------------------------------------------+
//| Special Convertion Functions                                     |
//+------------------------------------------------------------------+

int LastTradeTime;
double ExtHistoBuffer[];
double ExtHistoBuffer2[];

void SetLoopCount(int loops)
{
}

void SetIndexValue(int shift, double value)
{
  ExtHistoBuffer[shift] = value;
}

void SetIndexValue2(int shift, double value)
{
  ExtHistoBuffer2[shift] = value;
}

//+------------------------------------------------------------------+
//| End                                                              |
//+------------------------------------------------------------------+

//+------------------------------------------------------------------+
//| Initialization                                                   |
//+------------------------------------------------------------------+

int init()
{
   SetIndexStyle(0, DRAW_ARROW, STYLE_SOLID);
   SetIndexBuffer(0, ExtHistoBuffer);
   SetIndexStyle(1, DRAW_ARROW, STYLE_SOLID);
   SetIndexBuffer(1, ExtHistoBuffer2);
   SetIndexArrow(1,233);
   SetIndexArrow(0,234);
   return(0);
}
int start()
{
//+------------------------------------------------------------------+
//| Local variables                                                  |
//+------------------------------------------------------------------+
int shift = 0;
double sell = 0;
double buy = 0;


SetLoopCount(0);
// loop from first bar to current bar (with shift=0)
for(shift=Bars-1;shift>=0 ;shift--){
	SetIndexValue(shift, 0);
	SetIndexValue2(shift, 0);
}

for(shift=Bars-100;shift>=0 ;shift--){


if((Close[shift]<Open[shift]) && (Open[shift]-Close[shift]>body*Point)){
   sell=High[shift]+15*Point;buy=0.00001;}  else sell=0.00001;

if((Close[shift]>Open[shift]) && (Close[shift]-Open[shift]>body*Point)){
   buy=Low[shift]-15*Point;sell=0.00001;}  else buy=0.00001;

   SetIndexValue(shift,sell);SetIndexValue2(shift,buy);}   return(0);
}
Comments