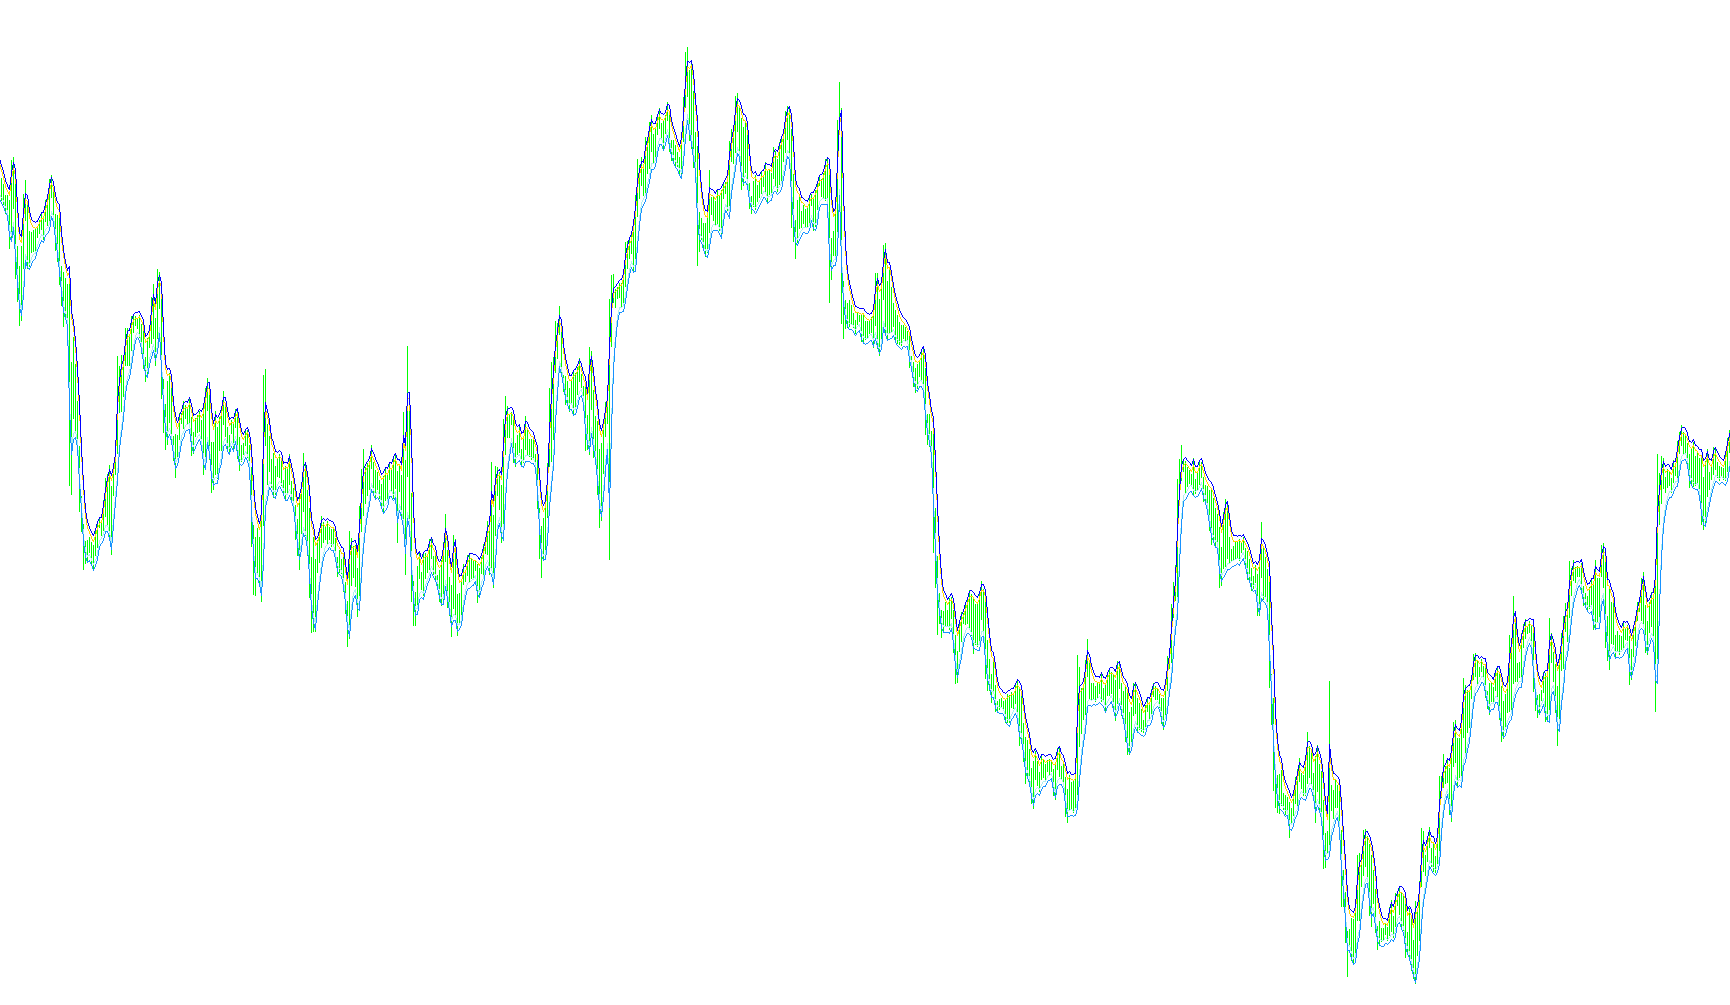
This tool is designed to provide visual guidance on a trading chart by identifying specific price boundaries based on moving averages. It creates a structured "band" system that helps traders visualize the immediate range of price movement and potential volatility.
Core Mechanics
The logic operates by calculating two primary sets of lines, each consisting of a base average and an offset boundary:
- The Upper Boundary (Resistance): The script identifies the highest prices over a specific period to create a baseline. It then projects a secondary line above this baseline at a fixed distance. This helps in identifying "ceiling" levels where price might face resistance.
- The Lower Boundary (Support): Conversely, the script looks at the lowest prices over the same period to establish a floor. It then projects a second line below this level to identify "foundation" areas where price might find support.
Key Components of the Logic
To ensure the bands are useful for analysis, the script relies on three main customizable factors:
- The Time Horizon (Length): This determines how far back into the past the tool looks to calculate the averages. A shorter length makes the bands highly reactive to immediate price changes, while a longer length smooths out the data to show broader trends.
- The Calculation Mode: This defines how the average is weighted—specifically whether it prioritizes recent price data more heavily than older data, which influences how quickly the bands move in response to new information.
- The Distance (Delta): This is the "spread" of the bands. It dictates exactly how far away from the central averages the upper and lower boundaries are placed. By adjusting this, a user can widen or narrow the visual corridor of the price action.
Practical Application
In essence, the script transforms raw price data into a four-line corridor. By observing where the price sits in relation to these bands, traders can get a clearer picture of whether the market is currently expanding, contracting, or testing its boundaries. It provides a constant visual reference for the "active zone" of the market at any given moment.
/*-----------------------------+
|			       |
| Shared by www.Aptrafx.com    |
|			       |
+------------------------------*/

//+------------------------------------------------------------------+
//|                                                  EMABands_v1.mq4 |
//|                                  Copyright © 2006, Forex-TSD.com |
//|                         Written by IgorAD,igorad2003@yahoo.co.uk |
//|            http://finance.groups.yahoo.com/group/TrendLaboratory |
//+------------------------------------------------------------------+
#property copyright "Copyright © 2006, Forex-TSD.com "
#property link      "http://www.forex-tsd.com/"

#property indicator_chart_window
#property indicator_buffers 4
#property indicator_color1 Blue
#property indicator_color2 Aqua
#property indicator_color3 Red
#property indicator_color4 Magenta

//---- input parameters
extern int Length=3;
extern int MA_mode=1;
extern int Delta=15;

//---- indicator buffers
double UpBuffer1[];
double UpBuffer2[];
double DnBuffer1[];
double DnBuffer2[];

//+------------------------------------------------------------------+
//| Custom indicator initialization function                         |
//+------------------------------------------------------------------+
  int init()
  {
   string short_name;
//---- indicator line
   SetIndexStyle(0,DRAW_LINE);
   SetIndexStyle(1,DRAW_LINE);
   SetIndexStyle(2,DRAW_LINE);
   SetIndexStyle(3,DRAW_LINE);

   SetIndexBuffer(0,UpBuffer1);
   SetIndexBuffer(1,UpBuffer2);
   SetIndexBuffer(2,DnBuffer1);
   SetIndexBuffer(3,DnBuffer2);
//---- name for DataWindow and indicator subwindow label
   short_name="EMABands("+Length+")";
   IndicatorShortName(short_name);
   SetIndexLabel(0,"Up1");
   SetIndexLabel(1,"Up2");
   SetIndexLabel(2,"Dn1");
   SetIndexLabel(3,"Dn2");
//----
   SetIndexDrawBegin(0,Length);
   SetIndexDrawBegin(1,Length);
   SetIndexDrawBegin(2,Length);
   SetIndexDrawBegin(3,Length);

//----
   return(0);
  }

//+------------------------------------------------------------------+
//| EMABands_v1                                                     |
//+------------------------------------------------------------------+
int start()
  {

   int shift,limit, counted_bars=IndicatorCounted();

   if ( counted_bars > 0 )  limit=Bars-counted_bars;
   if ( counted_bars < 0 )  return(0);
   if ( counted_bars ==0 )  limit=Bars-Length-1;

	for(shift=limit;shift>=0;shift--)
   {
   UpBuffer1[shift] = iMA(NULL,0,Length,0,MA_mode,PRICE_HIGH,shift);
   UpBuffer2[shift] = UpBuffer1[shift] + Delta*Point;
	DnBuffer1[shift] = iMA(NULL,0,Length,0,MA_mode,PRICE_LOW,shift);
   DnBuffer2[shift] = DnBuffer1[shift] - Delta*Point;
	}
	return(0);
 }
Comments