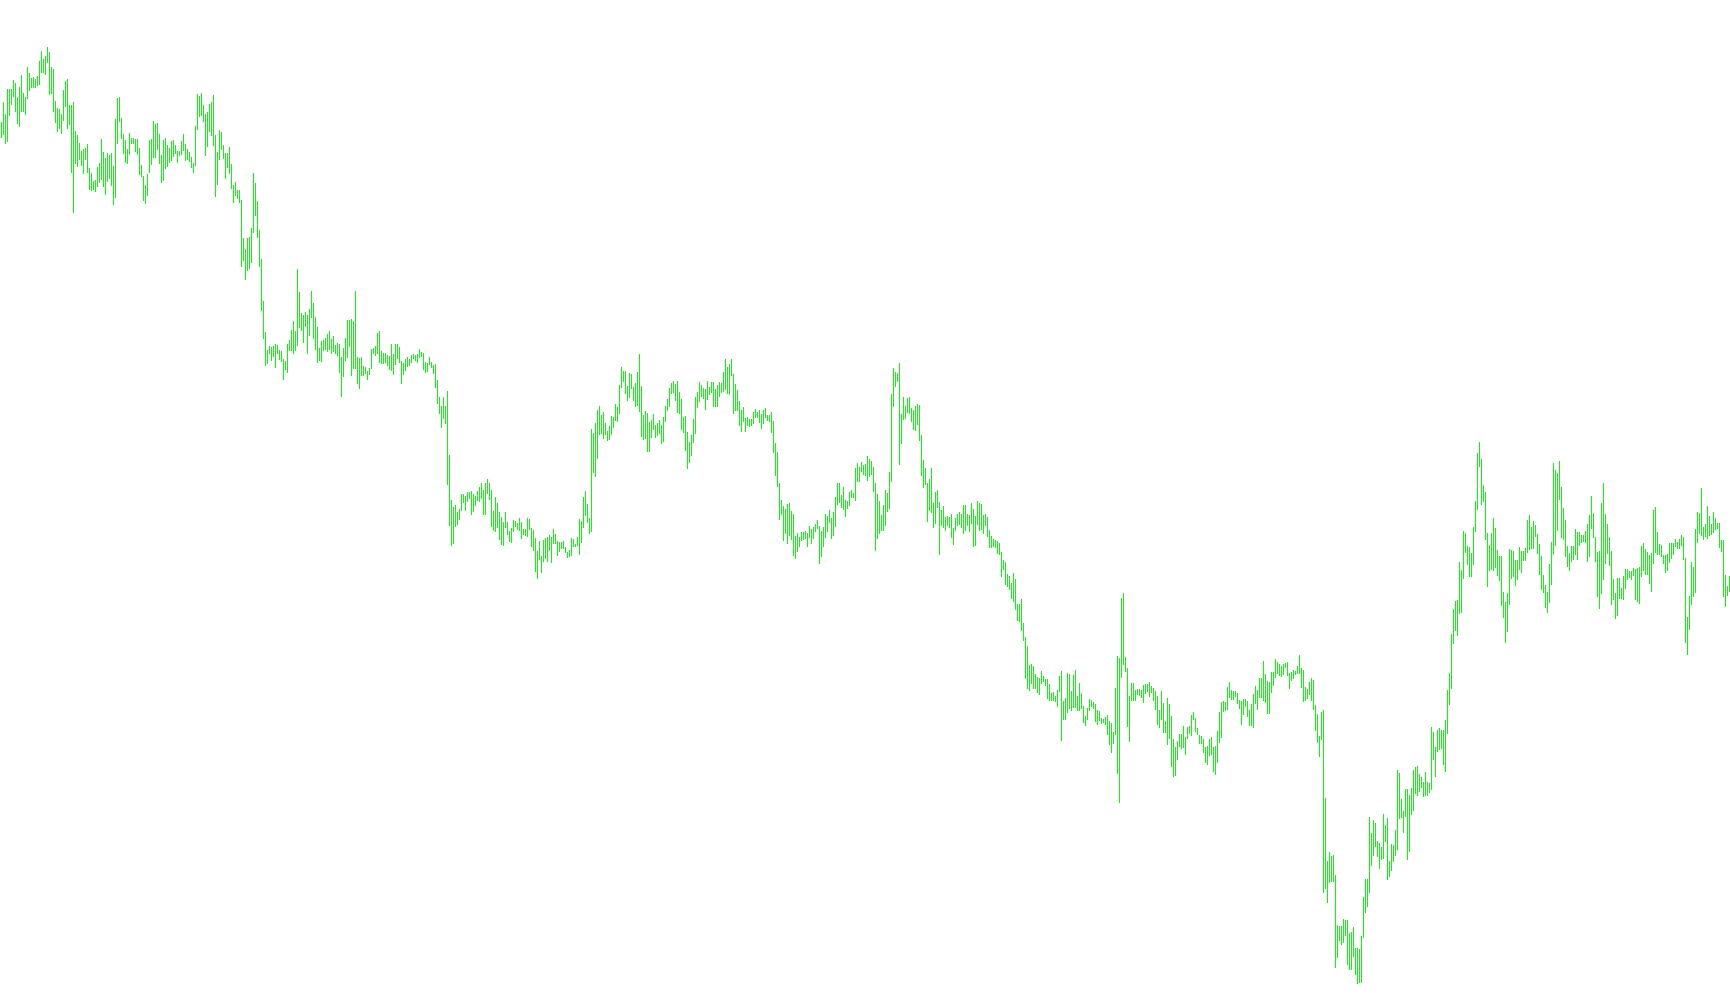
This tool is designed to analyze price trends by measuring the "spread" or distance between different moving averages on a specific timeframe. Instead of just showing you where the price is, it focuses on the mathematical relationship between three different types of Moving Averages (MAs) to help identify market momentum and structural shifts.
Core Logic Overview
The script operates by looking at three distinct Moving Averages simultaneously: one with a short duration, one with a medium duration, and one with a longer duration. By calculating the difference between these averages, the tool creates a visual representation of how the price is accelerating or decelerating.
Key Components of the Logic:
- Multi-Timeframe Alignment: The script is programmed to sync with specific timeframes (specifically the 1-hour and 4-hour charts). It identifies where historical price points align across these larger timeframes to ensure the data remains consistent.
- The "Spread" Calculation: Rather than plotting the averages themselves, the logic focuses on the gaps between them:
- It calculates the difference between the Short and Medium averages.
- It calculates the difference between the Medium and Long averages.
- It calculates the total difference between the Short and Long averages.
- User-Selectable Focus (Options): The script includes a selection system that allows the user to choose which specific set of calculations they want to see on their chart. This allows you to toggle between different "versions" of the spread analysis depending on your trading preference.
- Historical Processing: The tool scans back through a significant amount of historical data (defined by the user) to populate the visual lines, allowing traders to see how these spreads have expanded or contracted over time.
Visual Output
The result is displayed in a separate window as three distinct lines. These lines represent the varying degrees of separation between the moving averages. When these lines move together, it suggests a unified trend; when they diverge or fluctuate significantly, it indicates changes in the strength or volatility of that trend.
//+------------------------------------------------------------------+
//|                                                   Better_MA.mq4  |
//|                      Copyright © 2007, MetaQuotes Software Corp. |
//|                                        http://www.metaquotes.net |
//+------------------------------------------------------------------+
#property copyright "Copyright © 2007, MetaQuotes Software Corp."
#property link      "http://www.metaquotes.net"

#property indicator_separate_window
#property indicator_buffers 3
#property indicator_color1 Lime
#property indicator_color2 Aqua
#property indicator_color3 White


extern int NrBars=1000;
extern int Option=2;//0,1,2

string SymbolName;
int PeriodMinutes1=0;
int PeriodMinutes5=PERIOD_M5;
int PeriodMinutes60=PERIOD_H1;
int PeriodMinutes240=PERIOD_H4;


//---- buffers
double VolBuffer1[];
double VolBuffer2[];
double VolBuffer3[];
double x0,x1,x2,x3,x4,x5,x6,x7,x8,x9;
double y0,y1,y2,y3,y4,y5,y6,y7,y8,y9;
double z0,z1,z2,z3,z4,z5,z6,z7,z8,z9;

double at0,at1,at2,at3,at4,at5,at6,at7,at8;
double at9,at10,at11,at12,at13,at14,at15,at16,at17;
double at18,at19,at20,at21,at22,at23,at24,at25,at26;

//+------------------------------------------------------------------+
//| Custom indicator initialization function                         |
//|------------------------------------------------------------------|

int init()
  {


    SymbolName = Symbol();


   IndicatorBuffers(3);

   SetIndexStyle(0,DRAW_LINE,0,1);
   SetIndexBuffer(0, VolBuffer1);

   SetIndexEmptyValue(0,EMPTY_VALUE);

   SetIndexStyle(1,DRAW_LINE,0,1);
   SetIndexBuffer(1, VolBuffer2);

   SetIndexEmptyValue(1,EMPTY_VALUE);

   SetIndexStyle(2,DRAW_LINE,0,1);
   SetIndexBuffer(2, VolBuffer3);

   SetIndexEmptyValue(2,EMPTY_VALUE);

   return(0);
  }


//+------------------------------------------------------------------+
//| Custor indicator deinitialization function                       |
//+------------------------------------------------------------------+
int deinit()
  {

  }

//+------------------------------------------------------------------+
//| Custom indicator iteration function                              |
//+------------------------------------------------------------------+
int start()
  {

   for (int i=NrBars-1;i>=0;i--)
      {
      datetime time1=iTime(SymbolName,PeriodMinutes1,i);

//      int b5=iBarShift(SymbolName,PeriodMinutes5,time1,true);
      int b60=iBarShift(SymbolName,PeriodMinutes60,time1,true);
//      int b240=iBarShift(SymbolName,PeriodMinutes240,time1,true);

/*
      if(b5>=0)
      {
        x0=iClose(SymbolName,PeriodMinutes5,b5);

        x1=iMA(SymbolName,PeriodMinutes5,5,0,MODE_SMA,PRICE_CLOSE,b5);
        x2=iMA(SymbolName,PeriodMinutes5,10,0,MODE_SMA,PRICE_CLOSE,b5);
        x3=iMA(SymbolName,PeriodMinutes5,15,0,MODE_SMA,PRICE_CLOSE,b5);

        at0=x1-x2;
        at1=x2-x3;
        at2=x1-x3;

        y1=iMA(SymbolName,PeriodMinutes5,5,0,MODE_SMA,PRICE_CLOSE,b5+1);
        y2=iMA(SymbolName,PeriodMinutes5,10,0,MODE_SMA,PRICE_CLOSE,b5+1);
        y3=iMA(SymbolName,PeriodMinutes5,15,0,MODE_SMA,PRICE_CLOSE,b5+1);

        at9=y1-y2;
        at10=y2-y3;
        at11=y1-y3;

        z1=iMA(SymbolName,PeriodMinutes5,5,0,MODE_SMA,PRICE_CLOSE,b5+2);
        z2=iMA(SymbolName,PeriodMinutes5,10,0,MODE_SMA,PRICE_CLOSE,b5+2);
        z3=iMA(SymbolName,PeriodMinutes5,15,0,MODE_SMA,PRICE_CLOSE,b5+2);

        at18=z1-z2;
        at19=z2-z3;
        at20=z1-z3;
      }
*/


      if(b60>=0)
      {
        x4=iMA(SymbolName,PeriodMinutes60,5,0,MODE_SMA,PRICE_CLOSE,b60);
        x5=iMA(SymbolName,PeriodMinutes60,10,0,MODE_SMA,PRICE_CLOSE,b60);
        x6=iMA(SymbolName,PeriodMinutes60,15,0,MODE_SMA,PRICE_CLOSE,b60);

        at3=x4-x5;
        at4=x5-x6;
        at5=x4-x6;

        y4=iMA(SymbolName,PeriodMinutes60,5,0,MODE_SMA,PRICE_CLOSE,b60+1);
        y5=iMA(SymbolName,PeriodMinutes60,10,0,MODE_SMA,PRICE_CLOSE,b60+1);
        y6=iMA(SymbolName,PeriodMinutes60,15,0,MODE_SMA,PRICE_CLOSE,b60+1);

        at12=y4-y5;
        at13=y5-y6;
        at14=y4-y6;

        z4=iMA(SymbolName,PeriodMinutes60,5,0,MODE_SMA,PRICE_CLOSE,b60+2);
        z5=iMA(SymbolName,PeriodMinutes60,10,0,MODE_SMA,PRICE_CLOSE,b60+2);
        z6=iMA(SymbolName,PeriodMinutes60,15,0,MODE_SMA,PRICE_CLOSE,b60+2);

        at21=z4-z5;
        at22=z5-z6;
        at23=z4-z6;
      }
/*
      if(b240>=0)
      {
        x7=iMA(SymbolName,PeriodMinutes240,5,0,MODE_SMA,PRICE_CLOSE,b240);
        x8=iMA(SymbolName,PeriodMinutes240,10,0,MODE_SMA,PRICE_CLOSE,b240);
        x9=iMA(SymbolName,PeriodMinutes240,15,0,MODE_SMA,PRICE_CLOSE,b240);
        at6=x7-x8;
        at7=x8-x9;
        at8=x7-x9;
        y7=iMA(SymbolName,PeriodMinutes240,5,0,MODE_SMA,PRICE_CLOSE,b240+1);
        y8=iMA(SymbolName,PeriodMinutes240,10,0,MODE_SMA,PRICE_CLOSE,b240+1);
        y9=iMA(SymbolName,PeriodMinutes240,15,0,MODE_SMA,PRICE_CLOSE,b240+1);

        at15=y7-y8;
        at16=y8-y9;
        at17=y7-y9;
        z7=iMA(SymbolName,PeriodMinutes240,5,0,MODE_SMA,PRICE_CLOSE,b240+2);
        z8=iMA(SymbolName,PeriodMinutes240,10,0,MODE_SMA,PRICE_CLOSE,b240+2);
        z9=iMA(SymbolName,PeriodMinutes240,15,0,MODE_SMA,PRICE_CLOSE,b240+2);
        at24=z7-z8;
        at25=z8-z9;
        at26=z7-z9;
      }
*/
   if(Option==0)
   {
	  VolBuffer1[i]=at3;
 	  VolBuffer2[i]=at4;
 	  VolBuffer3[i]=at5;
 	}
 	else if(Option==1)
   {
	  VolBuffer1[i]=at12;
 	  VolBuffer2[i]=at13;
 	  VolBuffer3[i]=at14;
 	}
 	else if(Option==2)
   {
	  VolBuffer1[i]=at21;
 	  VolBuffer2[i]=at22;
 	  VolBuffer3[i]=at23;
 	}


  }


   return(0);
  }
//+------------------------------------------------------------------+
Comments