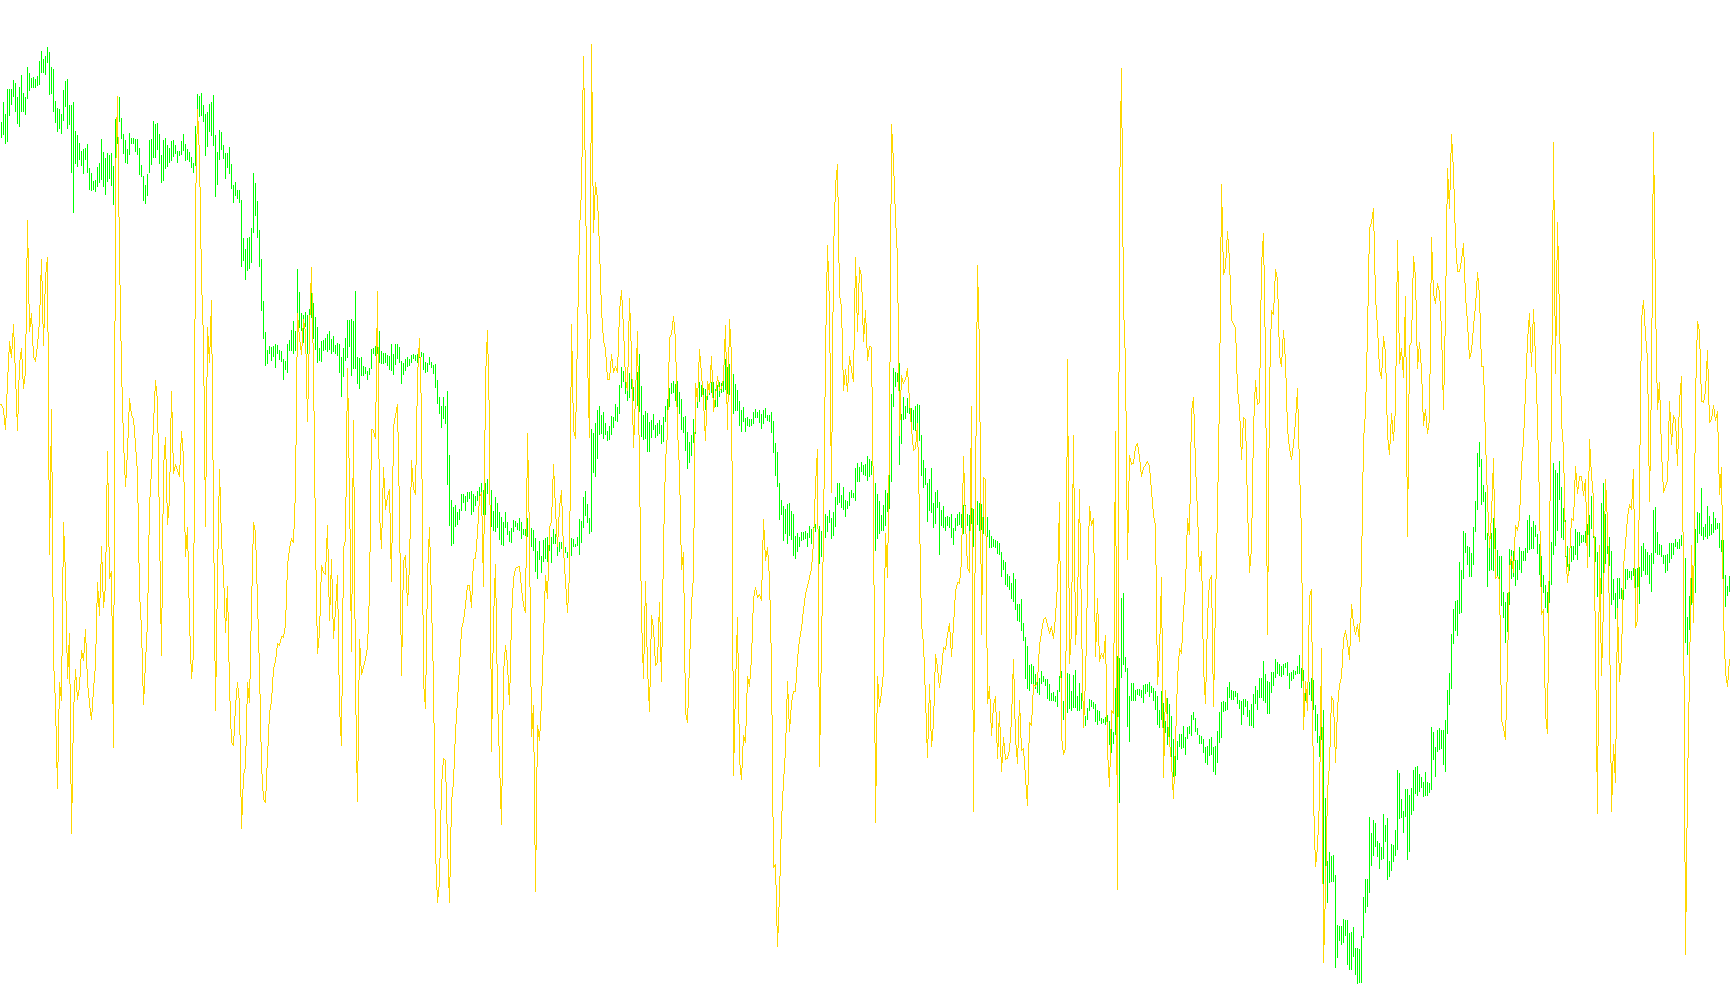
Overview
This script is a custom technical analysis tool designed for the MetaTrader platform. Its primary purpose is to measure where the current price sits in relation to specific volatility boundaries, providing a visual representation of market "extremes." Instead of simply showing you the price movement, it converts complex volatility data into a standardized numerical value that makes it easier to identify overbought or oversold conditions.
How the Logic Works
The tool operates based on a mathematical concept known as Bollinger Bands, which consist of an upper and lower boundary calculated using a moving average and standard deviation (a measure of how much prices typically swing up and down).
While standard Bollinger Bands show you these boundaries as lines on your chart, this specific script simplifies that information into a single indicator. Here is the step-by-step logic:
- Boundary Calculation: The script looks at a specific timeframe of historical data (defined by the user) to determine the "High" and "Low" volatility limits.
- Position Tracking: It identifies where the current closing price sits between those two limits.
- Relative Percentage Mapping: Rather than showing the raw price, the script calculates the relative position as a percentage. It measures the distance from the lower boundary to the current price and divides it by the total distance between the lower and upper boundaries.
Practical Interpretation
The result is plotted in a separate window at the bottom of your trading screen. This allows you to see the "momentum" of the price relative to its recent volatility:
- Near the Top: If the indicator value moves toward the upper limit, it suggests that the price is pushing against the historical ceiling, potentially indicating that the asset is becoming overextended in an upward direction.
- Near the Bottom: If the indicator value moves toward the lower limit, it suggests the price is testing the historical floor, which may indicate an oversold condition.
- The Center: A reading in the middle indicates that the price is trading within its normal expected range based on recent volatility.
By using this script, traders can more easily visualize whether the market is reaching a "stretched" state without having to manually calculate the distance between price action and volatility bands.
/*-----------------------------+
|			       |
| Shared by www.Aptrafx.com    |
|			       |
+------------------------------*/

//+-------------------------------------------------------------------+
//|                                            Bollinger Bands %b.mq4 |
//|                       Copyright © 2004, MetaQuotes Software Corp. |
//|                                         http://www.metaquotes.net |
//|                                     Modified by Alejandro Galindo |
//|                                                                   |
//|                                            You are free to use it |
//|                                                                   |
//|       If you want and if this work/modification is helpful to you |
//|              you can send me a PayPal donation to ag@elcactus.com |
//+-------------------------------------------------------------------+
#property copyright "Copyright © 2004, MetaQuotes Software Corp."
#property link      "http://www.metaquotes.net/"

#property indicator_separate_window
#property indicator_buffers 1
#property indicator_color1 Yellow
//---- input parameters
extern int BBPeriod=20;
extern int StdDeviation=2;
//---- buffers
double BLGBuffer[];
//+------------------------------------------------------------------+
//| Custom indicator initialization function                         |
//+------------------------------------------------------------------+
int init()
  {
   string short_name;
//---- indicator line
   SetIndexStyle(0,DRAW_LINE);
   SetIndexBuffer(0,BLGBuffer);
//---- name for DataWindow and indicator subwindow label
   short_name="BBpB("+BBPeriod+","+StdDeviation+")";
   IndicatorShortName(short_name);
   SetIndexLabel(0,short_name);
//----
   SetIndexDrawBegin(0,BBPeriod);
//----
   return(0);
  }
//+------------------------------------------------------------------+
//| Momentum                                                         |
//+------------------------------------------------------------------+
int start()
  {
   int i,counted_bars=IndicatorCounted();
//----
   if(Bars<=BBPeriod) return(0);
//---- initial zero
   if(counted_bars<1)
      for(i=1;i<=BBPeriod;i++) BLGBuffer[Bars-i]=0.0;
//----
   i=Bars-BBPeriod-1;
   if(counted_bars>=BBPeriod) i=Bars-counted_bars-1;
   while(i>=0)
     {
      BLGBuffer[i]=(Close[i]-iBands(NULL,0,BBPeriod,StdDeviation,0,0,MODE_HIGH,i))/(iBands(NULL,0,BBPeriod,StdDeviation,0,0,MODE_LOW,i)-iBands(NULL,0,BBPeriod,StdDeviation,0,0,MODE_HIGH,i));
      i--;
     }
   return(0);
  }
//+------------------------------------------------------------------+
Comments