Pivot-2
Download script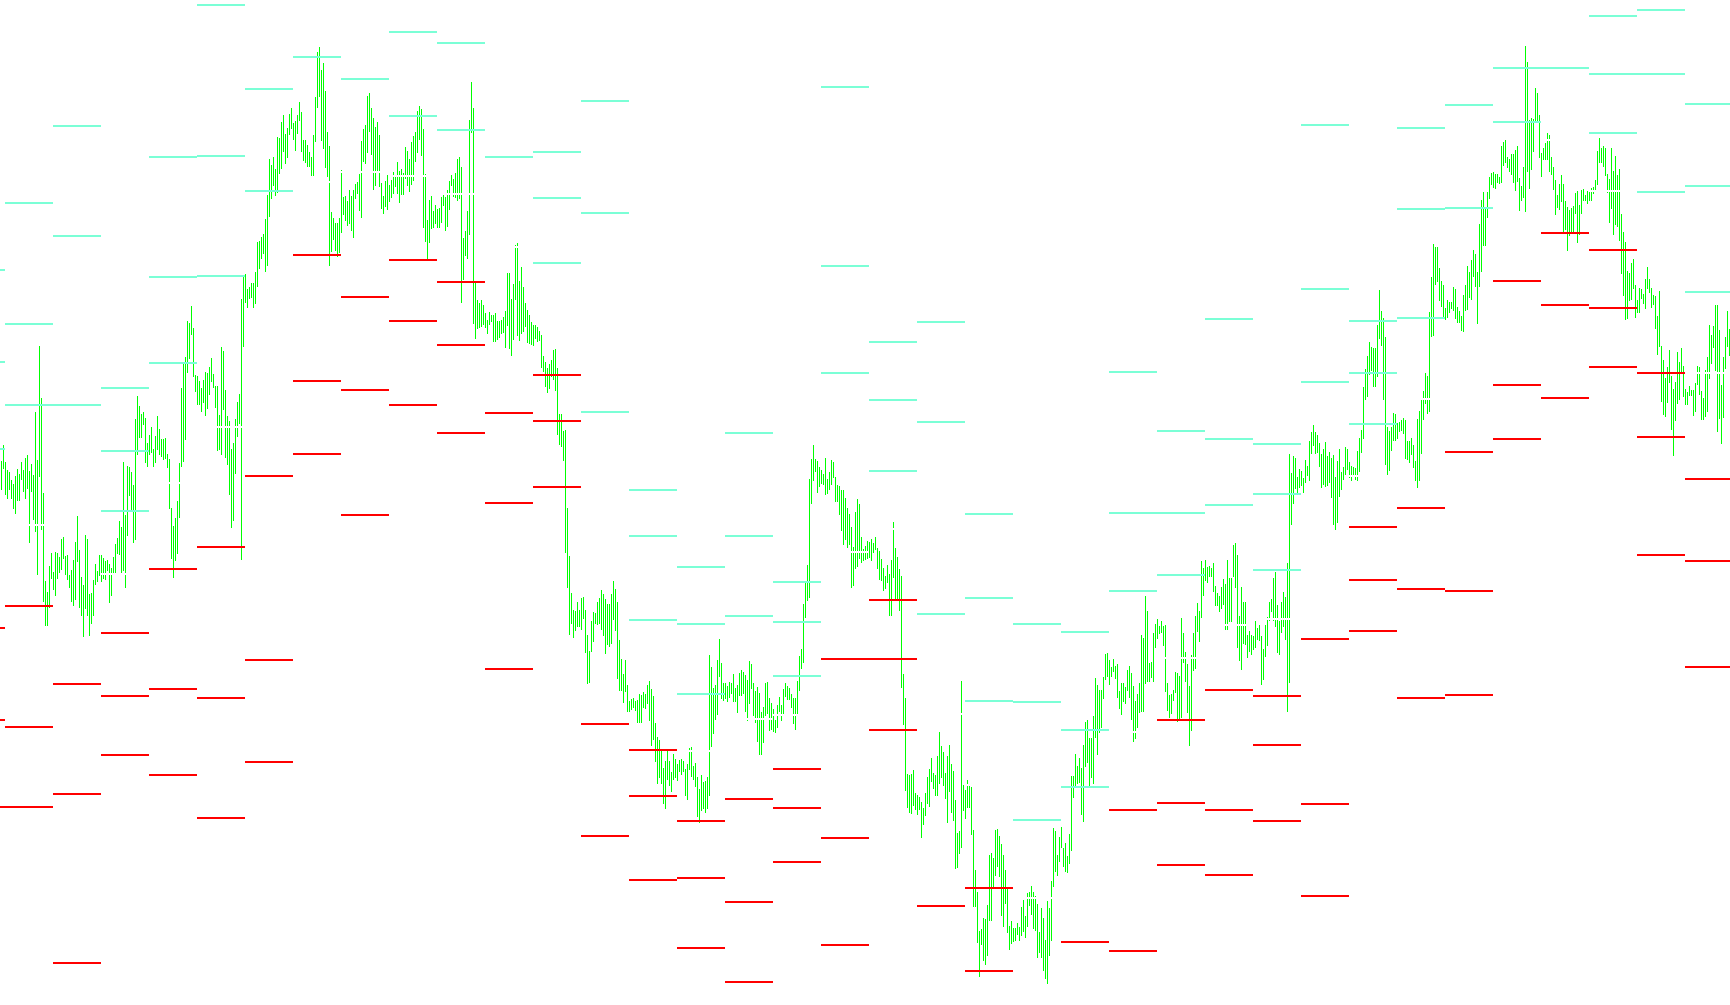
This script is designed to function as a visual technical analysis tool for traders, specifically by identifying and plotting key price levels known as Pivot Points. These points are essential for understanding potential areas of support (where price might stop falling) and resistance (where price might stop rising).
Core Logic Overview
The tool works by analyzing historical price data to calculate seven specific levels for every new trading day. Instead of relying on random numbers, it uses the actual mathematical extremes of the previous day's trading session to project where the price is likely to react today.
How the Calculations Work
The script follows a structured logic to determine these levels:
- Data Gathering: The tool looks back at the previous day's price action to identify three critical pieces of information: the highest price reached (High), the lowest price reached (Low), and the closing price (Close).
- The Pivot Point (P): This is the "center" or equilibrium point for the day. The script calculates this by averaging the previous day's high, low, and closing price.
- Resistance Levels (R1, R2, R3): These are calculated based on the distance between the Pivot Point and the previous day's lows and highs. They represent "ceilings." As the numbers increase (from R1 to R3), they represent progressively higher, more extreme price targets.
- Support Levels (S1, S2, S3): These are calculated using a similar logic to the resistance levels but focus on the "floors." They represent the price levels where buyers are expected to step in to prevent further downward movement.
Dynamic Visual Updates
The script performs several automated actions to ensure the trader has a clear view of the market:
- Daily Detection: The tool is programmed to recognize when a new day begins on the chart. Every time a new day starts, it automatically recalculates all seven levels based on the completed data from the day before.
- Visual Plotting: It places specific markers (arrows/dots) on the chart at each calculated level so the trader can see them clearly without needing to do manual math.
- On-Screen Dashboard: In addition to the visual markers, the script provides a real-time text summary in the corner of the screen. This allows traders to see the exact numerical values of all three resistance and three support levels instantly.
- Automatic Cleanup: When the tool is removed from the chart, it includes a "deinitialization" routine that cleans up the visual objects, ensuring the chart remains tidy and free of leftover markers.
Summary for the Trader
In short, this script automates the math required to identify the "map" of the current day's trading range. It tells you where the boundaries are based on yesterday's behavior, providing a clearer picture of where the market might struggle to break through or bounce back from.
//+------------------------------------------------------------------+
//|                                                        Pivot-2.mq4 |
//|                               Copyright © 2004, Poul_Trade_Forum |
//|                                                         Aborigen |
//|                                          http://forex.kbpauk.ru/ |
//+------------------------------------------------------------------+
#property copyright "Poul Trade Forum"
#property link      "http://forex.kbpauk.ru/"

#property indicator_chart_window
//#property indicator_separate_window
#property indicator_buffers 7
#property indicator_color1 Orange
#property indicator_color2 Lime
#property indicator_color3 Maroon
#property indicator_color4 Lime
#property indicator_color5 Maroon
#property indicator_color6 Lime
#property indicator_color7 Green

//---- input parameters
extern int CountBars=300;
//---- buffers
double PBuffer[];
double S1Buffer[];
double R1Buffer[];
double S2Buffer[];
double R2Buffer[];
double S3Buffer[];
double R3Buffer[];
string Pivot="P",Sup1="S 1", Res1="R 1";
string Sup2="S 2", Res2="R 2", Sup3="S 3", Res3="R 3";
int fontsize=6;
double P,S1,R1,S2,R2,S3,R3;
double LastHigh,LastLow,x;

//+------------------------------------------------------------------+
//| Custor indicator deinitialization function                       |
//+------------------------------------------------------------------+
int deinit()
  {
//---- TODO: add your code here

   ObjectDelete("Pivot");
   ObjectDelete("Sup1");
   ObjectDelete("Res1");
   ObjectDelete("Sup2");
   ObjectDelete("Res2");
   ObjectDelete("Sup3");
   ObjectDelete("Res3");

//----
   return(0);
  }
//+------------------------------------------------------------------+
//| Custom indicator initialization function                         |
//+------------------------------------------------------------------+
int init()
  {
   string short_name;


//---- indicator line
   SetIndexStyle(0,DRAW_ARROW,2,1,White);
   SetIndexArrow(0,158);
   SetIndexStyle(1,DRAW_ARROW,2,1,Red);
   SetIndexArrow(1,158);
   SetIndexStyle(2,DRAW_ARROW,2,1,Aquamarine);
   SetIndexArrow(2,158);
   SetIndexStyle(3,DRAW_ARROW,2,1,Red);
   SetIndexArrow(3,158);
   SetIndexStyle(4,DRAW_ARROW,2,1,Aquamarine);
   SetIndexArrow(4,158);
   SetIndexStyle(5,DRAW_ARROW,2,1,Red);
   SetIndexArrow(5,158);
   SetIndexStyle(6,DRAW_ARROW,2,1,Aquamarine);
   SetIndexArrow(6,158);
    SetIndexBuffer(0,PBuffer);
   SetIndexBuffer(1,S1Buffer);
   SetIndexBuffer(2,R1Buffer);
   SetIndexBuffer(3,S2Buffer);
   SetIndexBuffer(4,R2Buffer);
   SetIndexBuffer(5,S3Buffer);
   SetIndexBuffer(6,R3Buffer);


//---- name for DataWindow and indicator subwindow label
short_name="Pivot";
   IndicatorShortName(short_name);
   SetIndexLabel(0,short_name);
short_name="Res1";
   IndicatorShortName(short_name);
   SetIndexLabel(2,short_name);
short_name="Res2";
   IndicatorShortName(short_name);
   SetIndexLabel(4,short_name);
short_name="Res3";
   IndicatorShortName(short_name);
   SetIndexLabel(6,short_name);
short_name="Sup1";
   IndicatorShortName(short_name);
   SetIndexLabel(1,short_name);
short_name="Sup2";
   IndicatorShortName(short_name);
   SetIndexLabel(3,short_name);
short_name="Sup3";
   IndicatorShortName(short_name);
   SetIndexLabel(5,short_name);


//----
   SetIndexDrawBegin(0,6);
//----


//----
   return(0);
  }

//+------------------------------------------------------------------+
//| Custom indicator iteration function                              |
//+------------------------------------------------------------------+
int start()

  {
   int    counted_bars=IndicatorCounted();

   int limit, i;
//---- indicator calculation
if (counted_bars==0)
{
   x=Period();
   if (x>CountBars) return(-1);
   //ObjectCreate("Pivot", OBJ_TEXT, 0, 0,0);
   //ObjectSetText("Pivot", "P",7,"Arial",White);
   //ObjectCreate("Sup1", OBJ_TEXT, 0, 0, 0);
   //ObjectSetText("Sup1", "s1",7,"Arial",White);
   //ObjectCreate("Res1", OBJ_TEXT, 0, 0, 0);
   //ObjectSetText("Res1", "r1",7,"Arial",White);
   //ObjectCreate("Sup2", OBJ_TEXT, 0, 0, 0);
   //ObjectSetText("Sup2", "s2",7,"Arial",White);
   //ObjectCreate("Res2", OBJ_TEXT, 0, 0, 0);
   //ObjectSetText("Res2", "r2",7,"Arial",White);
   //ObjectCreate("Sup3", OBJ_TEXT, 0, 0, 0);
   //ObjectSetText("Sup3", "s3",7,"Arial",White);
  // ObjectCreate("Res3", OBJ_TEXT, 0, 0, 0);
   //ObjectSetText("Res3", "r3",7,"Arial",White);
}
   if(counted_bars<0) return(-1);
//---- last counted bar will be recounted
//   if(counted_bars>0) counted_bars--;
   limit=(Bars-counted_bars)-1;


for (i=limit; i>=0;i--)
{

if (High[i+1]>LastHigh) LastHigh=High[i+1];
if (Low[i+1]<LastLow) LastLow=Low[i+1];

if (TimeDay(Time[i])!=TimeDay(Time[i+1]))
   {
   P=(LastHigh+LastLow+Close[i+1])/3;
   R1 = (2*P)-LastLow;
   S1 = (2*P)-LastHigh;
   R2 = P+(LastHigh - LastLow);
   S2 = P-(LastHigh - LastLow);
   R3 = (2*P)+(LastHigh-(2*LastLow));
   S3 = (2*P)-((2* LastHigh)-LastLow);
   LastLow=Open[i]; LastHigh=Open[i];

   ObjectMove("Pivot", 0, Time[i],P);
   ObjectMove("Sup1", 0, Time[i],S1);
   ObjectMove("Res1", 0, Time[i],R1);
   ObjectMove("Sup2", 0, Time[i],S2);
   ObjectMove("Res2", 0, Time[i],R2);
   ObjectMove("Sup3", 0, Time[i],S3);
   ObjectMove("Res3", 0, Time[i],R3);

   }

    PBuffer[i]=P;
    S1Buffer[i]=S1;
    R1Buffer[i]=R1;
    S2Buffer[i]=S2;
    R2Buffer[i]=R2;
    S3Buffer[i]=S3;
    R3Buffer[i]=R3;
Comment("Res3=",R3Buffer[i],"\n","Res2=",R2Buffer[i],"\n","Res1=",R1Buffer[i],"\n","Pivot=",PBuffer[i],"\n","Sup1=",S1Buffer[i],"\n","Sup2=",S2Buffer[i],"\n","Sup3=",S3Buffer[i]);
}

//----
   return(0);
  }
//+------------------------------------------------------------------+
Comments