Bollinger Bandwidth
Download script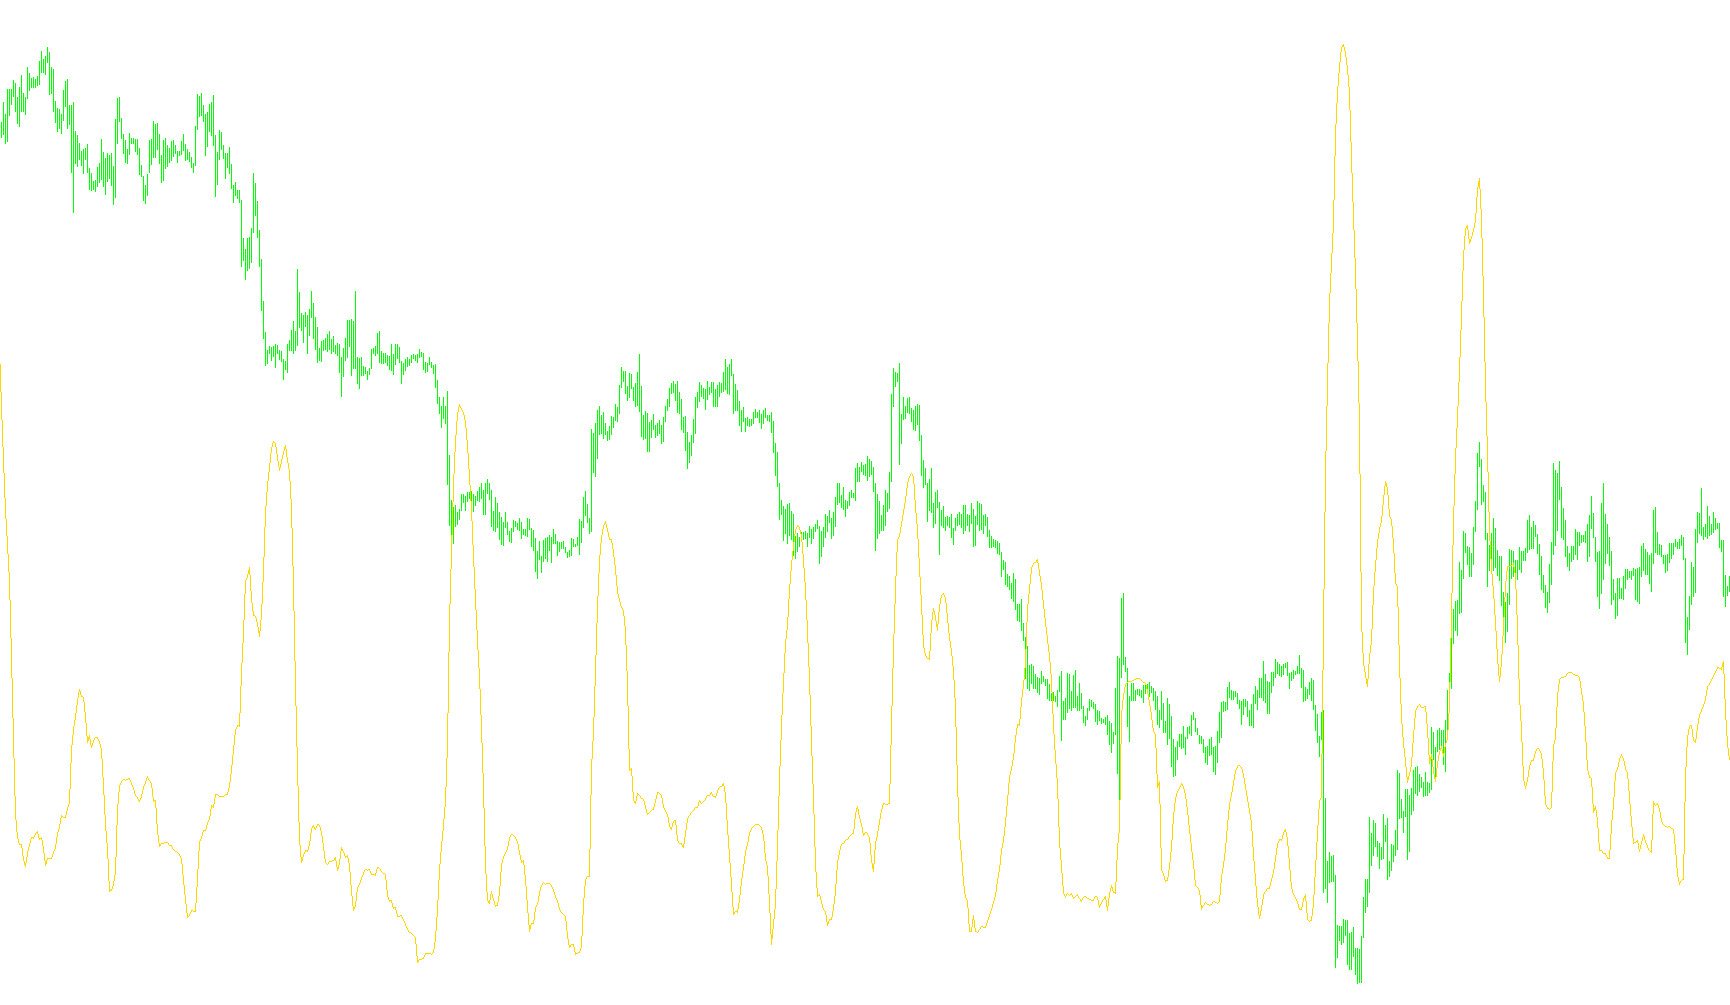
This tool is designed to measure and visualize the "expansion" or "contraction" of market price movements by calculating a specific metric known as Bandwidth. It provides traders with a way to gauge market volatility and the strength of current trends visually on a separate chart window.
Core Logic and Mechanism
The script operates based on the principle of measuring the distance between two boundaries: an upper limit and a lower limit of price action, relative to the average price. Here is how it processes that data:
1. Establishing the Boundaries (Bollinger Bands) The logic utilizes the standard Bollinger Band framework. It identifies a specific period of time (defaulting to 20 bars) and calculates a "Standard Deviation"—a mathematical way to measure how much the price fluctuates away from its average. This creates an upper boundary and a lower boundary around the current price.
2. Calculating the Width The tool measures the vertical distance between that upper boundary and the lower boundary. By subtracting the lower value from the upper value, the script determines the total "spread" of the market's movement at any given moment.
3. Normalizing the Data (Relative Scaling) To make this information more useful and consistent across different assets (like different currencies or stocks), the script does not just show the raw distance. Instead, it divides that distance by the Simple Moving Average (the "middle" price).
By dividing by the average price, the tool converts the raw measurement into a percentage-like ratio. This normalization ensures that the indicator remains readable regardless of whether the asset's price is very high or very low.
Practical Application for Traders
The resulting line on your chart represents the "pulse" of the market:
- High Values: When the line moves upward, it indicates that the price boundaries are widening, suggesting high volatility or a strong breakout in price movement.
- Low Values: When the line moves downward and stays tight, it suggests the market is consolidating, trading within a very narrow range with little significant movement.
//+-------------------------------------------------------------------+
//|                                                    Bandswidth.mq4 |
//|                                         by Linuxser for Forex TSD |
//|                                                                   |
//| John Bollinger original formula is:                               |
//| (Upper BB - Lower BB)/middle BB                                   |
//+-------------------------------------------------------------------+
#property copyright "Copyright © 2004, MetaQuotes Software Corp."
#property link      "http://www.metaquotes.net/"

#property indicator_separate_window
#property indicator_buffers 1
#property indicator_color1 RoyalBlue
#property indicator_width1 2
#property indicator_level1 0.0008


//---- input parameters
extern int BBPeriod=20;
extern int StdDeviation=2;
//---- buffers
double BLGBuffer[];
//+------------------------------------------------------------------+
//| Custom indicator initialization function                         |
//+------------------------------------------------------------------+
int init()
  {
   string short_name;
//---- indicator line
   SetIndexStyle(0,DRAW_LINE);
   SetIndexBuffer(0,BLGBuffer);
//---- name for DataWindow and indicator subwindow label
   short_name="Bandswidth("+BBPeriod+","+StdDeviation+")";
   IndicatorShortName(short_name);
   SetIndexLabel(0,short_name);
//----
   SetIndexDrawBegin(0,BBPeriod);
//----
   return(0);
  }
//+------------------------------------------------------------------+
//| Momentum                                                         |
//+------------------------------------------------------------------+
int start()
  {
   int i,counted_bars=IndicatorCounted();
//----
   if(Bars<=BBPeriod) return(0);
//---- initial zero
   if(counted_bars<1)
      for(i=1;i<=BBPeriod;i++) BLGBuffer[Bars-i]=0.0;
//----
   i=Bars-BBPeriod-1;
   if(counted_bars>=BBPeriod) i=Bars-counted_bars-1;
   while(i>=0)
     {
      BLGBuffer[i]= (iBands(NULL,0,BBPeriod,StdDeviation,0,PRICE_CLOSE,MODE_UPPER,i) - iBands(NULL,0,BBPeriod,StdDeviation,0,PRICE_CLOSE,MODE_LOWER,i))
      /iMA(NULL,0,BBPeriod,0,MODE_SMA,PRICE_CLOSE,i);
      i--;
     }
   return(0);
  }
//+------------------------------------------------------------------+
Comments