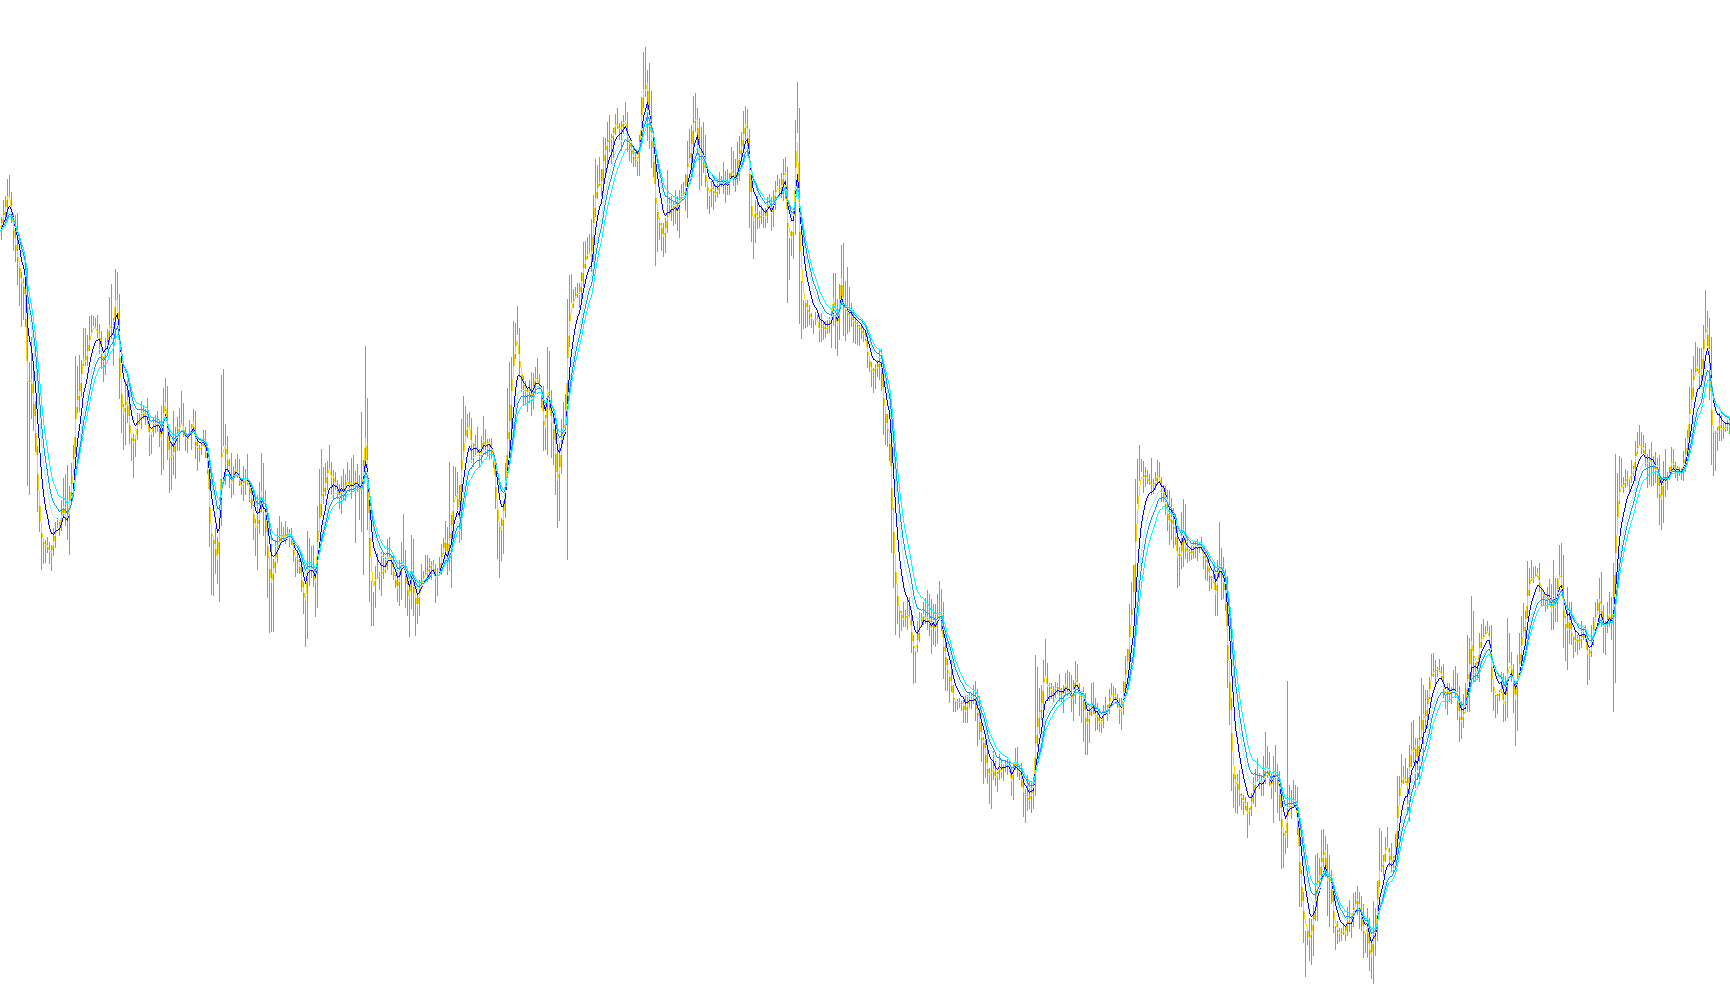
This technical indicator is designed to help traders visualize short-term price momentum by analyzing the relationship between several different moving averages simultaneously. Instead of relying on a single average, it employs a "bundle" approach to provide a clearer picture of current market sentiment.
How the Logic Works
The script calculates five distinct Exponential Moving Averages (EMAs) based on very short timeframes (specifically looking at periods of 3, 7, 10, 12, and 15 units). Because these averages are all calculated using the "Close" price of a candle, they react quickly to recent market changes.
By plotting all five of these lines together on your chart, the indicator allows you to see how different short-term price speeds interact with one another:
- Trend Identification: When these five lines move in the same direction and remain tightly grouped, it indicates a strong, cohesive short-term trend in the market.
- Momentum Strength: The wider or tighter the "bundle" of lines appears, it can signal how much agreement there is among different time horizons. If the lines are fanning out, it suggests expanding momentum; if they are crossing each other frequently, it may indicate a period of indecision or high volatility.
- Short-Term Sensitivity: Because this specific version focuses on "Short" settings, it is intended to capture rapid price fluctuations. It serves as a leading visual cue to identify immediate shifts in direction before they become obvious on longer-term charts.
Practical Application
Traders typically use this indicator to confirm entries or exits. By observing the "cluster" of gold lines, you can get a sense of whether the immediate "crowd" of price action is moving upward, downward, or staying flat. When used alongside other analysis tools, it provides a sophisticated way to filter out minor market noise and focus on the most relevant short-term trends.
//+------------------------------------------------------------------+
//|                        Guppy Mulitple Moving Average (Short).mq4 |
//|                                  Code written by - Matt Trigwell |
//|                                                                  |
//+------------------------------------------------------------------+

// ***** For information on how to use this fantastic indicator *****
// http://www.guppytraders.com/
// http://www.market-analyst.com/kb/article.php/Guppy_Multiple_Moving_Average
// http://tradermike.net/2004/05/another_look_at_multiple_moving_averages

// ***** INSTRUCTIONS *****
// Add the GMMA Short indicator and the GMMA Long indicator to your charts.
// This is the GMMA Short indicator


#property copyright "Code written by - Matt Trigwell"


#property indicator_chart_window
#property indicator_buffers 5
#property indicator_color1 Gold
#property indicator_color2 Gold
#property indicator_color3 Gold
#property indicator_color4 Gold
#property indicator_color5 Gold

//---- buffers
double ExtMapBuffer1[];
double ExtMapBuffer2[];
double ExtMapBuffer3[];
double ExtMapBuffer4[];
double ExtMapBuffer5[];

//+------------------------------------------------------------------+
//| Custom indicator initialization function                         |
//+------------------------------------------------------------------+
int init()
  {
//---- indicators
   SetIndexStyle(0,DRAW_LINE);
   SetIndexBuffer(0,ExtMapBuffer1);
   SetIndexStyle(1,DRAW_LINE);
   SetIndexBuffer(1,ExtMapBuffer2);
   SetIndexStyle(2,DRAW_LINE);
   SetIndexBuffer(2,ExtMapBuffer3);
   SetIndexStyle(3,DRAW_LINE);
   SetIndexBuffer(3,ExtMapBuffer4);
   SetIndexStyle(4,DRAW_LINE);
   SetIndexBuffer(4,ExtMapBuffer5);
//----
   return(0);
  }

int deinit()
  {
   return(0);
  }

int start()
  {
   int i,j,limit,counted_bars=IndicatorCounted();

   if(counted_bars<0) return(-1);
   if(counted_bars>0) counted_bars--;
   limit=Bars-counted_bars;

   for(i=0; i<limit; i++){
      ExtMapBuffer1[i]=iMA(NULL,0,3,0,MODE_EMA,PRICE_CLOSE,i);
      ExtMapBuffer2[i]=iMA(NULL,0,7,0,MODE_EMA,PRICE_CLOSE,i);
      ExtMapBuffer3[i]=iMA(NULL,0,10,0,MODE_EMA,PRICE_CLOSE,i);
      ExtMapBuffer4[i]=iMA(NULL,0,12,0,MODE_EMA,PRICE_CLOSE,i);
      ExtMapBuffer5[i]=iMA(NULL,0,15,0,MODE_EMA,PRICE_CLOSE,i);
   }

   return(0);
  }
//+------------------------------------------------------------------+
Comments