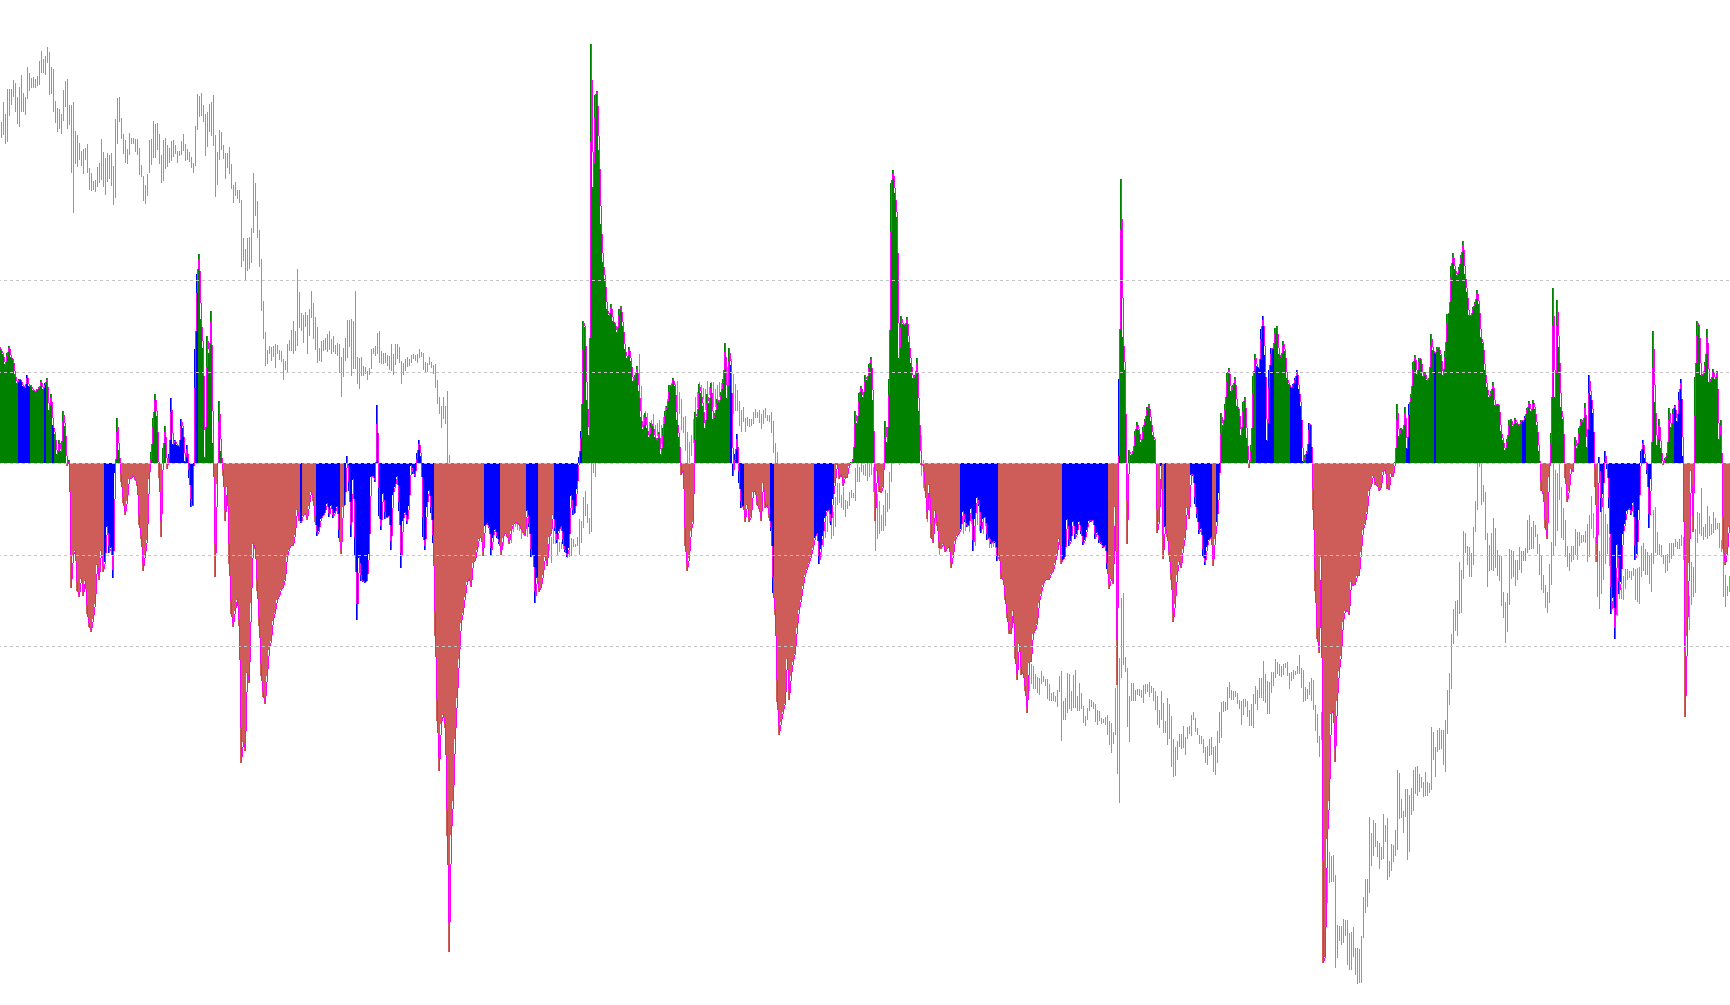
The Bollinger Squeeze v7 is a sophisticated technical analysis tool designed to identify periods of market consolidation and the subsequent "explosions" in price movement. By combining volatility measurements with momentum oscillators, it helps traders distinguish between a market that is simply moving sideways and one that is preparing for a significant breakout.
Core Logic Overview
The indicator operates on two primary pillars: Volatility Measurement (detecting the "Squeeze") and Momentum Analysis (identifying the direction of the move).
1. Identifying the "Squeeze" (Volatility)
The script calculates the relationship between two different types of price movement:
- Bollinger Bands: These represent standard deviation, showing how much the price is fluctuating relative to its average.
- Keltner Channels: These are based on Average True Range (ATR), which measures the actual range of price candles.
When the volatility measured by the Bollinger Bands becomes significantly narrower than the volatility measured by the Keltner Channels, the script identifies a "Squeeze." This suggests that the market is being compressed—like a spring being wound tight—and is likely to move sharply soon.
2. Determining Direction (Momentum)
To ensure traders don't just see when a move might happen but also in which direction it might go, the script incorporates a momentum "Trigger." Depending on your settings, the tool pulls data from one of three standard oscillators:
- Stochastic Oscillator: To identify overbought/oversold conditions.
- Commodity Channel Index (CCI): To measure where the price is relative to its statistical average.
- Relative Strength Index (RSI): To gauge the speed and change of price movements.
Visual Interpretation
The indicator displays these findings in a separate window below your main chart using color-coded histograms:
- Standard Momentum: When the market is moving normally, the indicator shows bars representing the current momentum.
- The Squeeze State: When the "Squeeze" condition is met (the price compression is extreme), the script changes how it displays data. It highlights these specific moments with distinct colors to alert you that volatility is at a low point and a breakout may be imminent.
Summary for Traders
In essence, this tool acts as an early-warning system. It filters out "market noise" by identifying periods of extreme compression (the Squeeze) and pairs that information with a momentum filter. This allows you to see where the market is most likely to transition from a quiet, sideways trend into a high-velocity move in a specific direction.
/*

*********************************************************************

                      Bollinger Squeeze v7
                  Original code by Nick Bilak
                   Modifications by Akuma99
                   Copyright © 2006  Akuma99
                  http://www.beginnertrader.com

       For help on this indicator, tutorials and information
               visit http://www.beginnertrader.com

*********************************************************************

*/

#property copyright "Copyright © 2006, Akuma99"
#property link      "http://www.beginnertrader.com "

#property indicator_separate_window
#property indicator_buffers 6
#property indicator_color1 Green
#property indicator_color2 IndianRed
#property indicator_color3 Blue
#property indicator_color4 Blue
#property indicator_color5 Blue
#property indicator_color6 Gray

int       bolPrd=20;
double    bolDev=2.0;
int       keltPrd=20;
double    keltFactor=1.5;
extern int       triggerType=2;
extern int       stochPeriod_trigger1=14;
extern int       cciPeriod_trigger2=50;
extern int       rsiPeriod_trigger3=14;

int       cciPeriod=50;

double upB[];
double loB[];
double upB2[];
double loB2[];
double mm[];
double cciline[];

int i,j,slippage=3;
double breakpoint=0.0;
double ema=0.0;
int peakf=0;
int peaks=0;
int valleyf=0;
int valleys=0, limit=0;
double ccis[61],ccif[61];
double delta=0;
double ugol=0;

int init() {

   IndicatorBuffers(6);

   SetIndexStyle(0,DRAW_HISTOGRAM,STYLE_SOLID,2,indicator_color1);
   SetIndexBuffer(0,upB);
   SetIndexEmptyValue(0,EMPTY_VALUE);

   SetIndexStyle(1,DRAW_HISTOGRAM,STYLE_SOLID,2,indicator_color2);
   SetIndexBuffer(1,loB);
   SetIndexEmptyValue(1,EMPTY_VALUE);

   SetIndexStyle(2,DRAW_HISTOGRAM,STYLE_SOLID,2,indicator_color3);
   SetIndexBuffer(2,upB2);
   SetIndexEmptyValue(2,EMPTY_VALUE);

   SetIndexStyle(3,DRAW_HISTOGRAM,STYLE_SOLID,2,indicator_color4);
   SetIndexBuffer(3,loB2);
   SetIndexEmptyValue(3,EMPTY_VALUE);

   SetIndexBuffer(4,mm);

   SetIndexStyle(5,DRAW_LINE);
   SetIndexBuffer(5,cciline);

   return(0);

}

int deinit() {

   SetLevelValue(1,NULL);
   SetLevelValue(2,NULL);
   SetLevelValue(3,NULL);
   SetLevelValue(4,NULL);

}
int start() {

   int counted_bars=IndicatorCounted();
   int shift,limit;
   double diff,d,std,bbs;

   if (counted_bars<0) return(-1);
   if (counted_bars>0) counted_bars--;
   limit=Bars-31;
   if(counted_bars>=31) limit=Bars-counted_bars-1;

   for (shift=limit;shift>=0;shift--)   {

      switch (triggerType) {
         case 1:
         d=iStochastic(NULL,0,stochPeriod_trigger1,3,3,MODE_SMA,0,MODE_MAIN,shift)-50;
         SetLevelValue(1,30);
         SetLevelValue(2,-30);
         IndicatorShortName("Bollinger Squeeze with Stochastic ("+stochPeriod_trigger1+",3,3)");
         break;
         case 2:
         d=iCCI(NULL,0,cciPeriod_trigger2,PRICE_CLOSE,shift);
         SetLevelValue(1,-200);
         SetLevelValue(2,-100);
         SetLevelValue(3,100);
         SetLevelValue(4,200);
         IndicatorShortName("Bollinger Squeeze with CCI ("+cciPeriod_trigger2+",CLOSE)");
         break;
         case 3:
         d=iRSI(NULL,0,rsiPeriod_trigger3,PRICE_CLOSE,shift)-50;
         SetLevelValue(1,20);
         SetLevelValue(2,-20);
         IndicatorShortName("Bollinger Squeeze with RSI ("+rsiPeriod_trigger3+",CLOSE)");
         break;
      }

      mm[shift]=d;

      if(d>0) {

         upB[shift]=d;

      } else if (d<0){

         loB[shift]=d;

      }

      cciline[shift]=d;

      diff = iATR(NULL,0,keltPrd,shift)*keltFactor;
      std = iStdDev(NULL,0,bolPrd,MODE_SMA,0,PRICE_CLOSE,shift);
      bbs = bolDev * std / diff;

      if(bbs<1) {

         if (d > 0) {
            upB2[shift]=d;
            upB[shift]=0;
            loB[shift]=0;
            loB2[shift]=0;
         } else {
            loB2[shift]=d;
            loB[shift]=0;
            upB[shift]=0;
            upB2[shift]=0;
         }
      } else {

         if (d > 0) {
            upB[shift]=d;
            upB2[shift]=0;
            loB[shift]=0;
            loB2[shift]=0;
         } else {
            loB[shift]=d;
            loB2[shift]=0;
            upB[shift]=0;
            upB2[shift]=0;
         }
      }
   }

   return(0);

}
Comments