CCI_Woodies [i]
Download script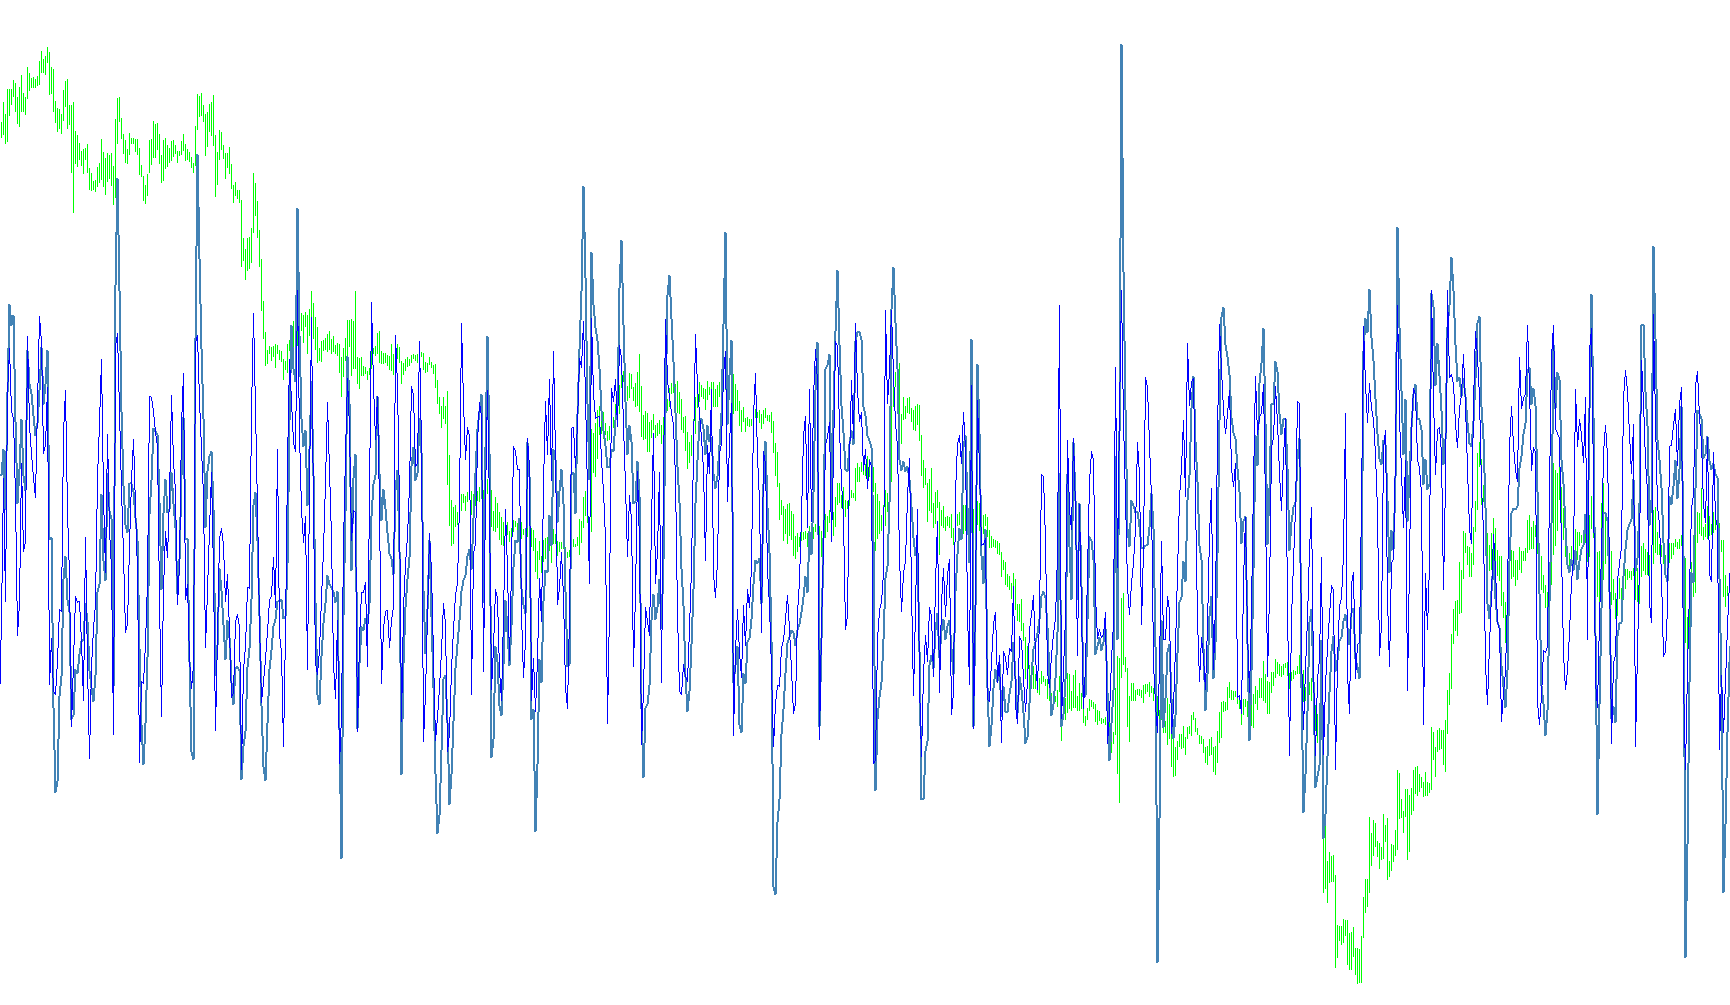
This tool is designed to help traders visualize market momentum by overlaying two different mathematical perspectives on a single chart. Instead of looking at just one speed of price movement, it allows you to see how short-term fluctuations interact with longer-term trends simultaneously.
How the Logic Works
The script operates by calculating two distinct versions of a technical indicator known as the Commodity Channel Index (CCI). It processes price data and generates two separate visual lines on your screen:
- The Long-Term Trend (Steel Blue Line): This line focuses on a broader window of time (set by the primary period). It smooths out minor market "noise" to show you the general direction and strength of the trend. Because it looks at a larger chunk of data, it moves more deliberately and represents the overall health of the market move.
- The Short-Term Momentum (Red Line): This line focuses on a much tighter window of time. It reacts quickly to sudden price spikes or dips. It is designed to capture "fast" movements, allowing you to see immediate shifts in sentiment before they become obvious on the larger trend line.
How to Interpret the Movement
By displaying these two lines together, the script provides a visual representation of market dynamics:
- Trend Alignment: When both lines move in the same direction, it suggests a strong, unified trend where both short-term traders and long-term trends agree on the price direction.
- Momentum Divergence: If the fast red line moves sharply while the blue line remains steady, it may indicate a temporary fluctuation or a "flicker" in price that hasn't yet changed the primary trend.
- Exhaustion Signals: When the gap between the two lines widens significantly, it can sometimes signal that the current move is becoming overextended, potentially hinting at a period of cooling off or a reversal.
In essence, this script acts as a dual-speed speedometer for your charts, helping you distinguish between a momentary "dash" in price and a sustained "marathon" movement.
//+------------------------------------------------------------------+
//|                                                  CCI_Woodies.mq4 |
//|                                                                  |
//|                                                                  |
//+------------------------------------------------------------------+

#property indicator_separate_window
#property indicator_buffers 2
#property indicator_color1 SteelBlue
#property indicator_color2 Red
//---- input parameters
extern int CCIPeriod1=14;
extern int CCIPeriod2=6;
//---- buffers
double CCIBuffer1[];
double CCIBuffer2[];
//+------------------------------------------------------------------+
//| Custom indicator initialization function                         |
//+------------------------------------------------------------------+
int init()
  {
   string short_name;
//---- indicator line
   SetIndexStyle(0,DRAW_LINE,STYLE_SOLID,2,SteelBlue);
   SetIndexStyle(1,DRAW_LINE);
   SetIndexBuffer(0,CCIBuffer1);
   SetIndexBuffer(1,CCIBuffer2);
//----
   SetIndexDrawBegin(0,CCIPeriod1);
   SetIndexDrawBegin(1,CCIPeriod1);
//----
   return(0);
  }
//+------------------------------------------------------------------+
//| CCI_Woodies                                                         |
//+------------------------------------------------------------------+
int start()
  {
   int i,counted_bars=IndicatorCounted();
//----
   if(Bars<=CCIPeriod1) return(0);
//---- initial zero
   if(counted_bars<1)
      for(i=1;i<=CCIPeriod1;i++) CCIBuffer1[Bars-i]=0.0;
//----
   i=Bars-CCIPeriod1-1;
   if(counted_bars>=CCIPeriod1) i=Bars-counted_bars-1;
   while(i>=0)
     {
      CCIBuffer1[i]=iCCI(NULL,0,CCIPeriod1,PRICE_TYPICAL,i);
      CCIBuffer2[i]=iCCI(NULL,0,CCIPeriod2,PRICE_TYPICAL,i);
      i--;
     }
   return(0);
  }
//+------------------------------------------------------------------+
Comments