GentorCCI_v2
Download script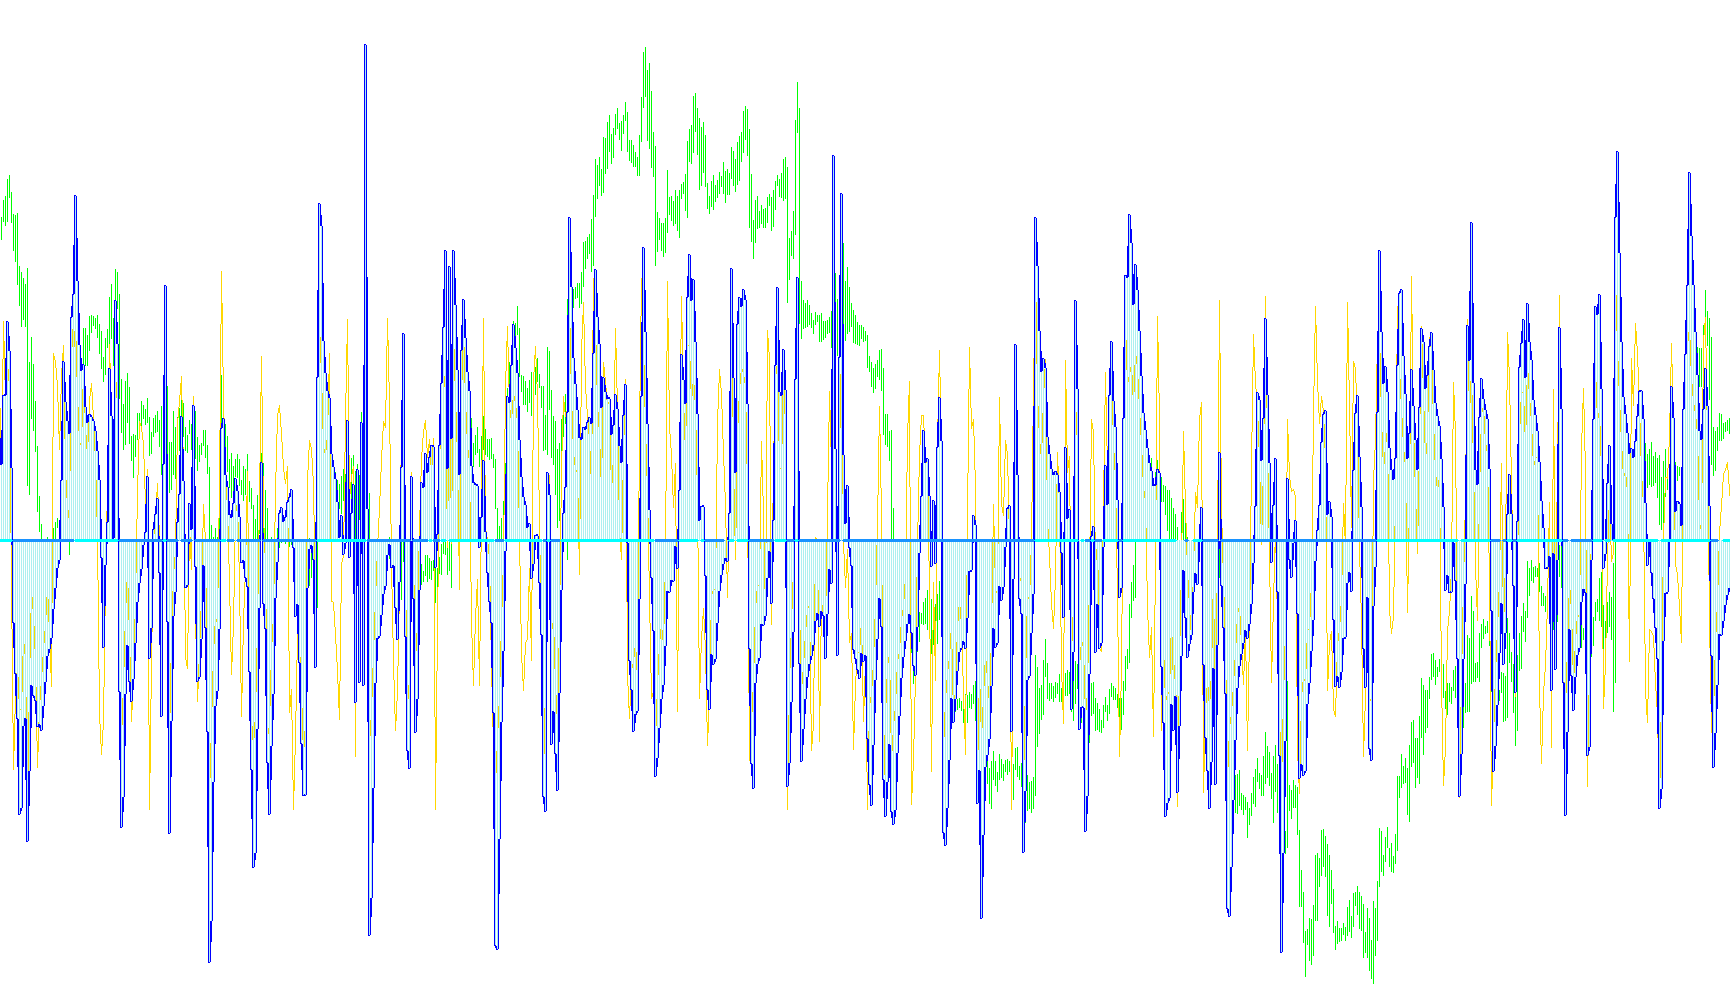
This technical tool is designed to provide traders with a multi-layered visual analysis of market momentum and price trends. By combining three distinct types of data—momentum oscillations, historical averages, and price position tracking—it helps users identify where the market is heading and how quickly it is moving in that direction.
Core Components of the Logic
1. Momentum Analysis (The CCI Layers) The tool utilizes the "Commodity Channel Index" (CCI), which measures the deviation of an asset's price from its average. The script processes this in three specific ways:
- Fast Momentum: Uses a short-term lookback period to detect immediate, rapid shifts in price action.
- Slow Momentum: Uses a longer-term lookback period to identify the broader established trend.
- Histogram Tracking: Provides a visual representation of the slow momentum, making it easier to see the "weight" or strength of the current move at a glance.
2. Trend Identification (The EMA Filter) Beyond just measuring speed, the script evaluates the overall health of the trend using an Exponential Moving Average (EMA). This acts as a dynamic baseline for the price. By calculating this average over a specific timeframe, the tool helps distinguish between temporary price fluctuations and a sustained directional move.
3. Dynamic Visual Coding The logic includes a specialized "filter" that monitors the relationship between the current market price and the EMA. Rather than just showing every data point equally, the script is designed to interact with these thresholds. It checks whether the current closing price is above or below the moving average, which serves as a primary signal for determining whether the prevailing market sentiment is bullish (upward) or bearish (downward).
How it Functions Together
When you view this on a chart, the script simultaneously calculates all these variables across hundreds of historical bars. It creates a comprehensive environment where:
- You can see how fast the price is moving relative to its history.
- You can see which direction that movement is heading over a longer duration.
- You can verify if the current price is supported by the broader trend established by the moving averages.
By merging these three perspectives, the tool aims to reduce "market noise," allowing traders to focus on high-probability movements where momentum and trend are in alignment.
//+------------------------------------------------------------------+
//|                                                   GentorCCIM .mq4|
//|                                                   Egorov Gennadiy|
//+------------------------------------------------------------------+
#property copyright "Egorov Gennadiy"
#property link      ""
#property indicator_separate_window
#property indicator_buffers 5
//----
#property indicator_color1 Red
#property indicator_color2 Black
#property indicator_color3 Lime
#property indicator_color4 Yellow
#property indicator_color5 Green
//---
#property indicator_level1 300
#property indicator_level2 200
#property indicator_level3 100
#property indicator_level4 50
#property indicator_level5 -50
#property indicator_level6 -100
#property indicator_level7 -200
#property indicator_level8 -300
//---- input parameters
extern int       A_period=14;
extern int       B_period=6;
extern int       EMA=34;
extern int       num_bars=300;
// parameters
int shift=0;
//---- buffers
double FastWoodieCCI[];
double SlowWoodieCCI[];
double HistoWoodieCCI[];
double LineHighEMA[];
double LineLowEMA[];
//---- indicator buffers
//+------------------------------------------------------------------+
//| Custom indicator initialization function                         |
//+------------------------------------------------------------------+
int init()
  {
   IndicatorDigits(2);
//---- indicators
   SetIndexStyle(0,DRAW_LINE,0,1);
   SetIndexBuffer(0,FastWoodieCCI);
   SetIndexStyle(1,DRAW_LINE,0,2);
   SetIndexBuffer(1,SlowWoodieCCI);
   SetIndexStyle(2,DRAW_HISTOGRAM,0,1);
   SetIndexBuffer(2,HistoWoodieCCI);
   SetIndexStyle(3,DRAW_LINE,1,3);
   SetIndexBuffer(3,LineHighEMA);
   SetIndexStyle(4,DRAW_LINE,1,3);
   SetIndexBuffer(4,LineLowEMA);
//---- initialization done
   return(0);
  }
//+------------------------------------------------------------------+
//| Custor indicator deinitialization function                       |
//+------------------------------------------------------------------+
int deinit()
  {
//---- TODO: add your code here
//----
   return(0);
  }
//+------------------------------------------------------------------+
//| Custom indicator iteration function                              |
//+------------------------------------------------------------------+
int start()
  {
   int   i;
   int   counted_bars=IndicatorCounted();
//---- check for possible errors
   if(counted_bars<0)
      return(-1);
//---- last counted bar will be recounted
   if(counted_bars > 0)
      counted_bars--;
//----
   counted_bars=Bars - counted_bars;
//----
   for(shift=0; shift < counted_bars; shift++)
     {
      //
      FastWoodieCCI[shift]=iCCI(NULL,0,B_period,PRICE_TYPICAL,shift);
      SlowWoodieCCI[shift]=iCCI(NULL,0,A_period,PRICE_TYPICAL,shift);
      HistoWoodieCCI[shift]=iCCI(NULL,0,A_period,PRICE_TYPICAL,shift);
      //----------------color coding---------------------------
      LineLowEMA[shift]=0;
      LineHighEMA[shift]=0;
//----
      double EmaValue=iMA( NULL, 0, EMA, 0, MODE_EMA, PRICE_TYPICAL, shift );
      if(Close[shift] > EmaValue )
         LineHighEMA[shift]=EMPTY_VALUE;
      else
         if (Close[shift] < EmaValue )
            LineLowEMA[shift]=EMPTY_VALUE;
     }
//---- done
   return(0);
  }
//+------------------------------------------------------------------+
Comments