Chaikin's Volatility (2 lines)_v2
Download script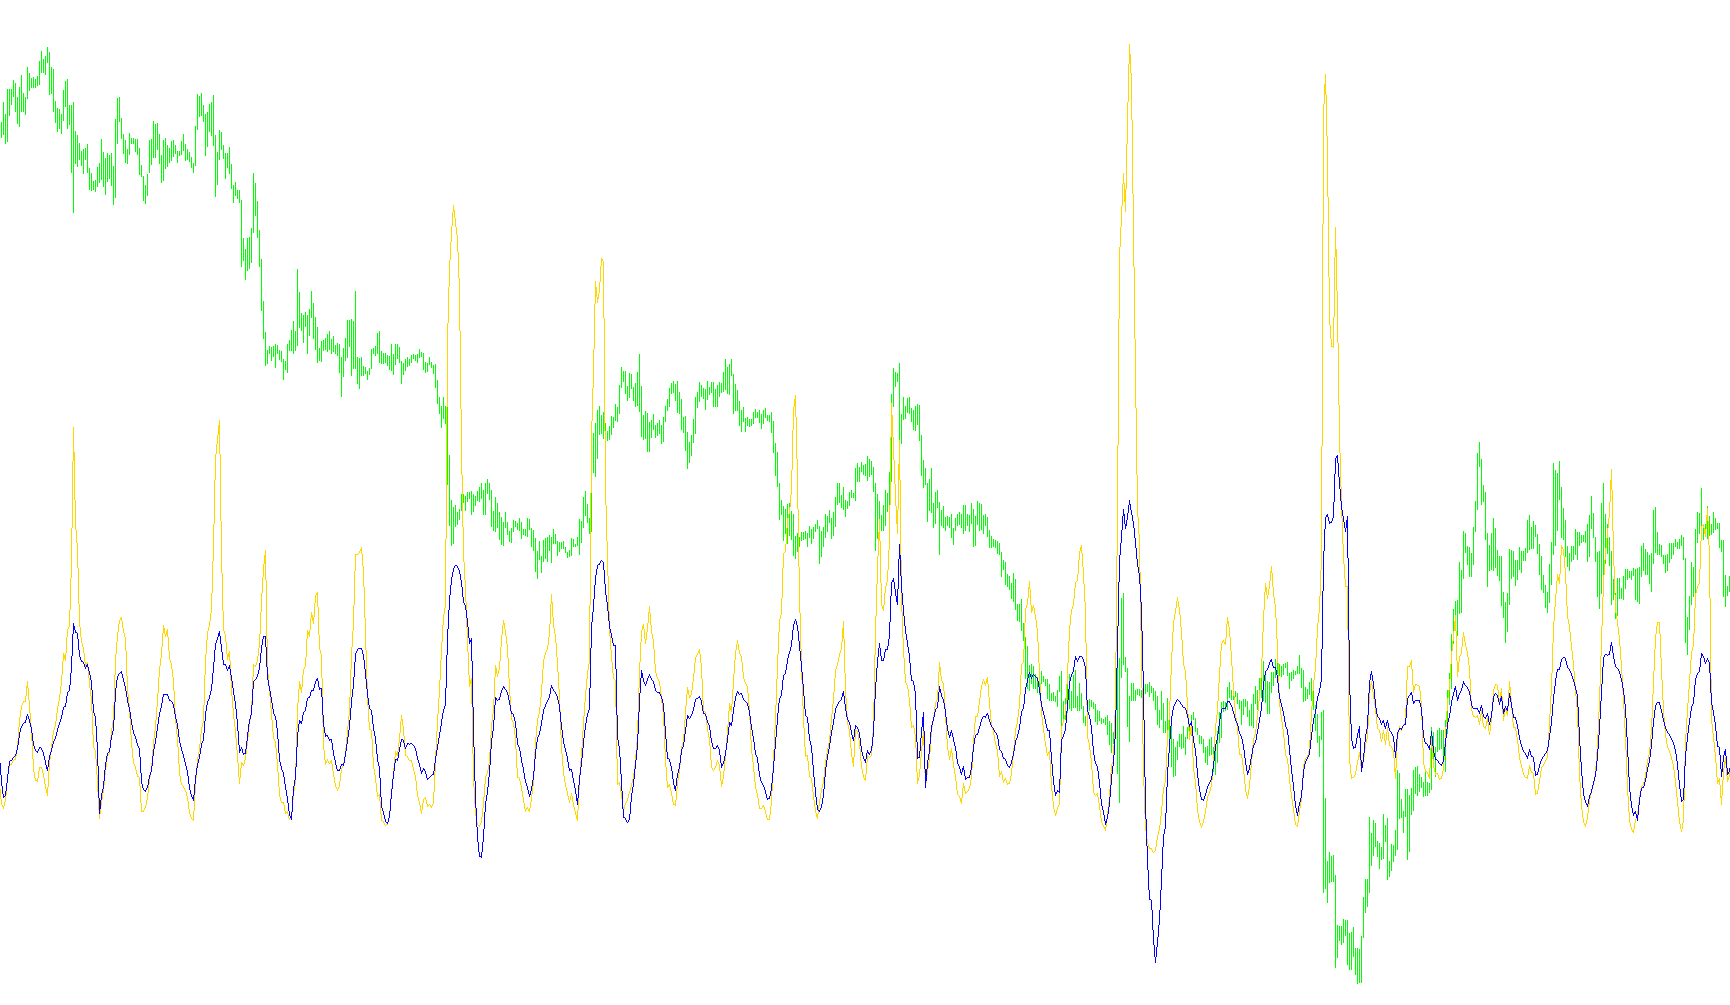
This indicator is designed to provide traders with a visual representation of market volatility and momentum by analyzing price fluctuations over specific timeframes. Instead of looking directly at the price, it focuses on the "range" of each candle—the distance between the highest and lowest points reached during a specific period.
Here is a breakdown of how the logic works:
Core Measurement: Price Range
The script begins by calculating the height of every candle on the chart. By subtracting the low price from the high price, it determines the total volatility for each individual bar. This helps the indicator ignore "noise" and focus solely on how much the price is actually moving.
Smoothing the Data
To make this information readable and prevent erratic jumps in the data, the script applies two different types of "Exponential Moving Averages" to those price ranges:
- Fast Average: This tracks the immediate volatility over a shorter period (default is 13).
- Slow Average: This tracks the broader volatility over a longer period (default is 26).
By using moving averages, the indicator creates smoother lines that represent the "trend" of the market's volatility rather than just raw, jagged price movements.
Calculating the Momentum (The Chaikin Volatility)
The final step of the logic involves comparing these two smoothed averages against each other to generate the primary visual signals:
- Standard Volatility: The script compares the current fast average against a past version of itself. It calculates the percentage change between these two points.
- Slow Volatility: Similarly, it compares the slow average against a much older point in time to see how the broader trend is shifting.
How to Interpret the Results
The output provides two distinct lines on a separate window below your main chart:
- One line represents shorter-term shifts in volatility.
- The other line represents longer-term trends in volatility.
By observing these lines, traders can identify when the market is expanding (increasing volatility) or contracting (decreasing volatility). When these lines move significantly away from their baseline or cross one another, it suggests a shift in market dynamics, helping to identify periods of intense activity or potential exhaustion in price movement.
//+------------------------------------------------------------------+
//|                                         Chaikin's Volatility.mq4 |
//|                                                          Kalenzo |
//|                                      bartlomiej.gorski@gmail.com |
//+------------------------------------------------------------------+
#property copyright "Kalenzo"
#property link      "bartlomiej.gorski@gmail.com"
//----
#property indicator_separate_window
#property indicator_buffers 5
//----
#property indicator_color1 Red
#property indicator_color2 Blue
//---- input parameters
extern int       iPeriod=13;
extern int       maPeriod=13;
extern int       maSlowPeriod=26;
//---- buffers
double chakin[];
double Slowchakin[];
double hl[];
double emahl[];
double Slowemahl[];
//+------------------------------------------------------------------+
//| Custom indicator initialization function                         |
//+------------------------------------------------------------------+
int init()
  {
//---- indicators
   IndicatorBuffers(5);
   SetIndexStyle(0,DRAW_LINE);
   SetIndexBuffer(0,chakin);
   SetIndexStyle(1,DRAW_LINE);
   SetIndexBuffer(1,Slowchakin);
   //
   SetIndexStyle(2,DRAW_NONE);
   SetIndexBuffer(2,hl);
   SetIndexStyle(3,DRAW_NONE);
   SetIndexBuffer(3,emahl);
   SetIndexStyle(4,DRAW_NONE);
   SetIndexBuffer(4,Slowemahl);
//----
   return(0);
  }
//+------------------------------------------------------------------+
//| Custom indicator deinitialization function                       |
//+------------------------------------------------------------------+
int deinit()
  {
//----
//----
   return(0);
  }
//+------------------------------------------------------------------+
//| Custom indicator iteration function                              |
//+------------------------------------------------------------------+
int start()
  {
   int limit;
   int counted_bars=IndicatorCounted();
   if(counted_bars<0) counted_bars=0;
   if(counted_bars>0) counted_bars--;
   limit=Bars-counted_bars;
//----
   for(int c=0 ;c<=limit ;c++) hl[c]=High[c]-Low[c];
   for(int e=0 ;e<=limit ;e++)
     {
      emahl[e]= iMAOnArray(hl,0,maPeriod,0,MODE_EMA,e);
      Slowemahl[e]= iMAOnArray(hl,0,maSlowPeriod,0,MODE_EMA,e);
     }
   for(int i=0 ;i<=limit-20 ;i++)
     {
      chakin[i] =((emahl[i]-emahl[i+iPeriod])/emahl[i+iPeriod])*100;
      Slowchakin[i] =((Slowemahl[i]-Slowemahl[i+iPeriod])/Slowemahl[i+maSlowPeriod])*100;
     }
//----
   return(0);
  }
//+------------------------------------------------------------------+
Comments