CHV
Download script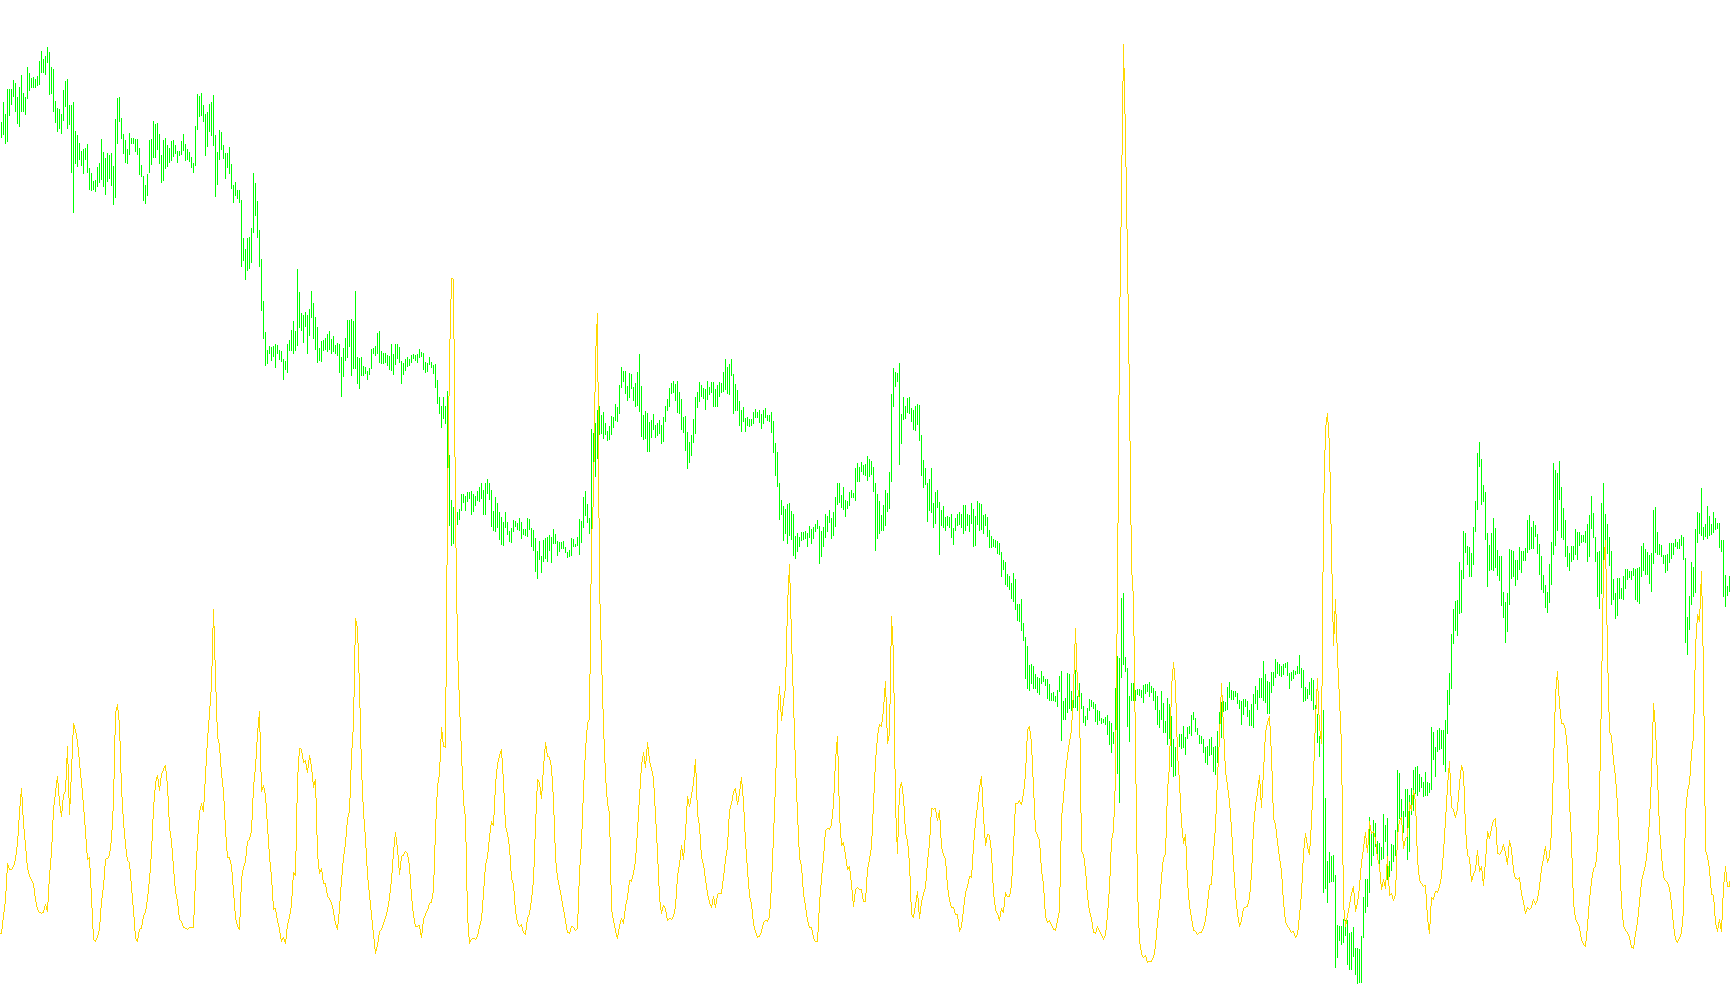
This tool, known as the Chaikin Volatility indicator, is designed to help traders visualize market activity by measuring fluctuations in price movement over a specific period. Instead of just looking at whether a price is going up or down, this script focuses on the "intensity" or "volatility" of those movements.
How the Logic Works
The script processes market data through three main stages to arrive at its final visual output:
1. Measuring Individual Price Range First, the tool looks at every individual candle on your chart. It calculates the difference between the highest price and the lowest price for each candle. This identifies the "stretch" of the price movement during that specific timeframe.
2. Smoothing the Data Because raw price fluctuations can be very jagged and noisy, the script applies a smoothing layer. Based on your settings, it takes those individual ranges and averages them out over a set number of periods. You can choose between two types of averaging:
- Simple Moving Average (SMA): A basic average that treats all periods equally.
- Exponential Moving Average (EMA): An average that gives more significance to recent price action. This smoothing helps filter out minor "市場 noise" so you can see the broader trend of volatility.
3. Calculating Percentage Change The final step is where the actual indicator value is born. The script compares the smoothed volatility of the current period against a previous point in time (determined by your chosen "ROC" or Rate of Change period).
By calculating the percentage difference between these two points, the tool provides a single line that shows how much volatility is increasing or decreasing relative to the past.
What this means for the user
Instead of a cluttered chart, you get a clean line in a separate window.
- Rising Line: Indicates that price fluctuations are expanding (increasing volatility).
- Falling Line: Indicates that price movements are compressing (decreasing volatility).
By monitoring these shifts, traders can better understand the strength behind market moves and identify periods of high tension or relative calm.
//+------------------------------------------------------------------+
//|                                                          CHO.mq4 |
//|                      Copyright © 2007, MetaQuotes Software Corp. |
//|                                        http://www.metaquotes.net |
//+------------------------------------------------------------------+
#property copyright "Copyright © 2007, MetaQuotes Software Corp."
#property link      "http://www.metaquotes.net"

#property  indicator_separate_window
#property indicator_buffers 1
#property indicator_color1 DarkBlue
//---- input parameters
extern int       SmoothPeriod=10;
extern int       ROCPeriod=10;
extern int       TypeSmooth=1;// 0 - SMA, 1 - EMA
//---- buffers
double CHV[];
double HL[];
//+------------------------------------------------------------------+
//| Custom indicator initialization function                         |
//+------------------------------------------------------------------+
int init()
  {
//---- indicators
   string name,smoothString;
   if (TypeSmooth<0 || TypeSmooth>1) TypeSmooth=1;
   if (TypeSmooth==0) smoothString="SMA"; else smoothString="EMA";
   name="Chaikin Volatility("+SmoothPeriod+","+smoothString+")";

   IndicatorBuffers(2);
   SetIndexStyle(0,DRAW_LINE);
   SetIndexBuffer(0,CHV);
   SetIndexLabel(0,name);
   SetIndexEmptyValue(0,0.0);
   SetIndexBuffer(1,HL);
   SetIndexEmptyValue(1,0.0);
   IndicatorShortName(name);
   IndicatorDigits(1);

//----
   return(0);
  }
//+------------------------------------------------------------------+
//| Custom indicator deinitialization function                       |
//+------------------------------------------------------------------+
int deinit()
  {
//----

//----
   return(0);
  }
//+------------------------------------------------------------------+
//| Custom indicator iteration function                              |
//+------------------------------------------------------------------+
int start()
  {
   int    counted_bars=IndicatorCounted();
   int limit,i;
   double curr_value,shift_value;
//----
   if (counted_bars<0) return(-1);

   if (counted_bars==0)
      {
      limit=Bars-1;
      for (i=limit;i>=0;i--)
        {
         HL[i]=High[i]-Low[i];
        }
      for(i=limit-2*SmoothPeriod;i>=0;i--)
        {
         curr_value=iMAOnArray(HL,0,SmoothPeriod,0,TypeSmooth,i);
         shift_value=iMAOnArray(HL,0,SmoothPeriod,0,TypeSmooth,i+ROCPeriod);
         CHV[i]=(curr_value-shift_value)/shift_value*100;
        }
      }

   if (counted_bars>0)
     {
      limit=Bars-counted_bars;
      for (i=limit;i>=0;i--)
        {
         HL[i]=High[i]-Low[i];
        }
      for(i=limit;i>=0;i--)
        {
         curr_value=iMAOnArray(HL,0,SmoothPeriod,0,TypeSmooth,i);
         shift_value=iMAOnArray(HL,0,SmoothPeriod,0,TypeSmooth,i+ROCPeriod);
         CHV[i]=(curr_value-shift_value)/shift_value*100;
        }
      }
//----
   return(0);
  }
//+------------------------------------------------------------------+
Comments