VKW Bands
Download script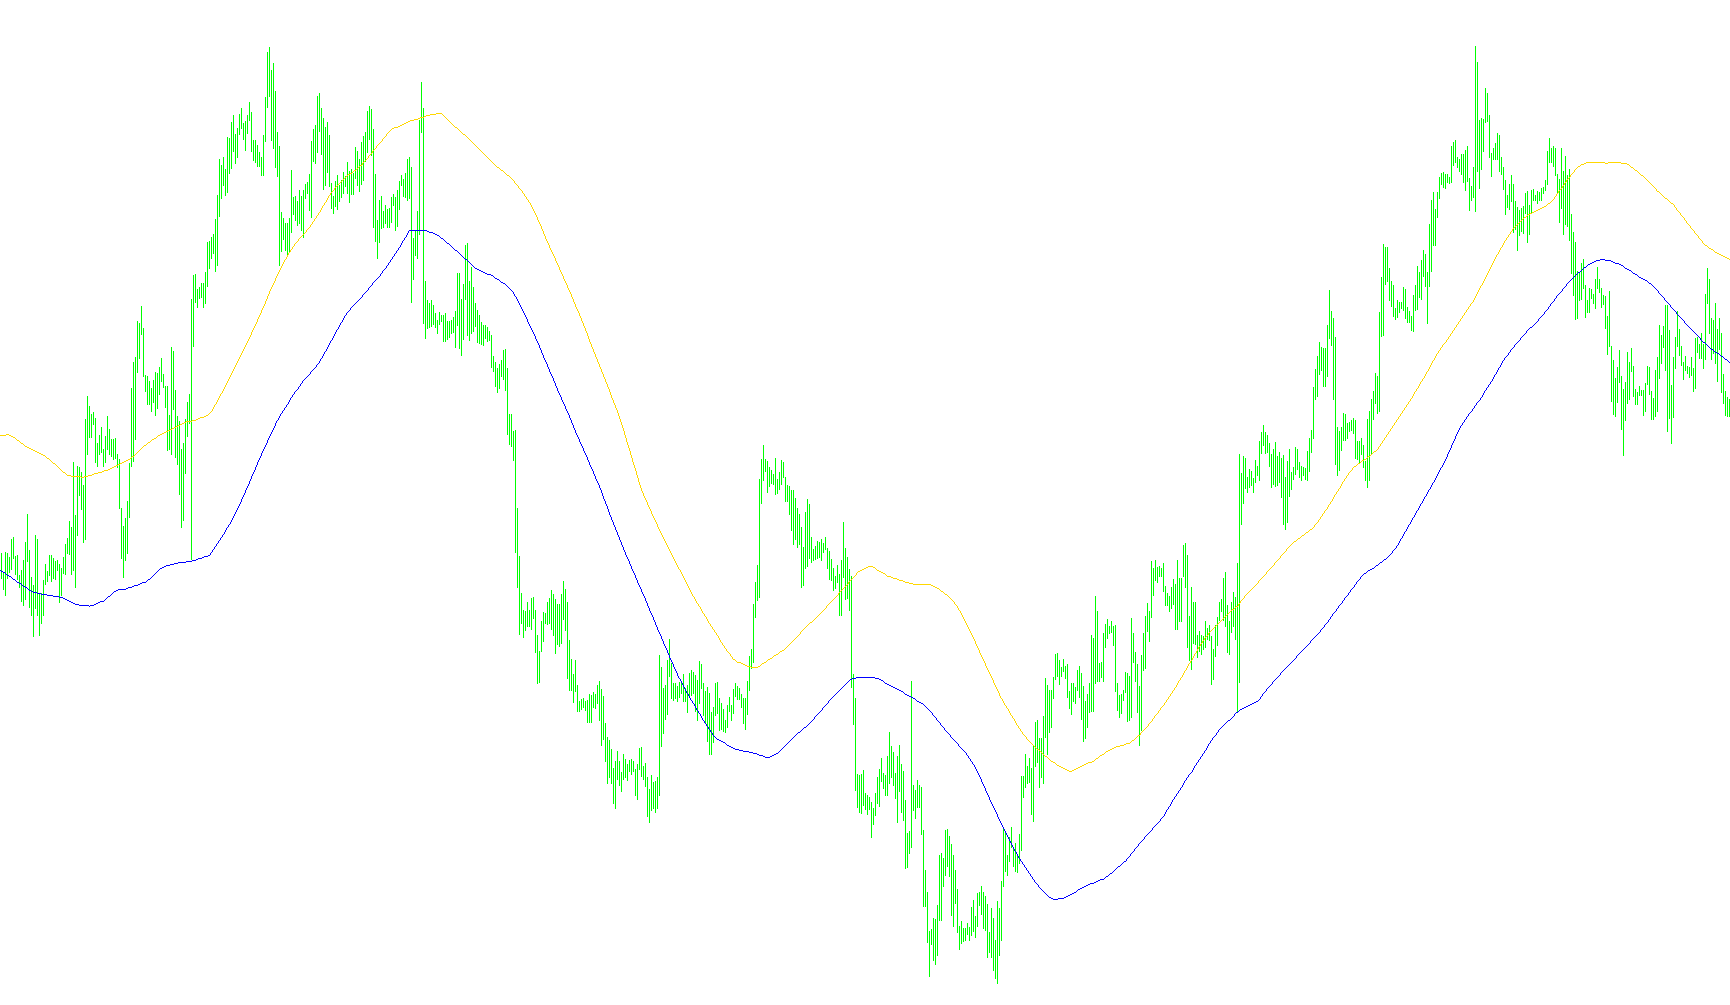
This script functions as a custom technical analysis tool designed to visualize specific price boundaries on a trading chart. It works by identifying extreme price points over a set period and then smoothing those values out to create clear, readable trends for the user.
How it Works
The logic operates in two primary stages:
1. Identifying Price Extremes First, the script looks back at a specific number of recent candles (defined by the "Range Period"). It scans this window to find the absolute highest price and the absolute lowest price reached. By focusing on these peaks and troughs rather than the average price, the tool captures the true boundaries of the market's recent movement.
2. Smoothing the Data Because raw high and low prices can be very jagged and erratic, the script applies a secondary layer of processing to these values. It calculates a moving average of those extremes over a longer period (defined by the "Smooth Period"). This process filters out the "noise" of minor fluctuations, resulting in two distinct lines on your chart.
What it Shows You
Instead of showing every tiny tick or price change, this tool provides a visual representation of the "ceiling" and "floor" of the market.
- One line represents the smoothed trend of recent highs.
- The other line represents the smoothed trend of recent lows.
By observing these two bands, traders can better understand the overall range in which the price is currently oscillating, helping to identify significant structural shifts in the market's momentum.
//+------------------------------------------------------------------+
//| VKW Bands.mq4.mq4
//| Rosh
//| http://www.investo.ru/forum/viewtopic.php?p=188196&sid=3564b6effe75d85c5526211453ddb860#188196
//+------------------------------------------------------------------+
#property copyright "Rosh"
#property link      "http://www.investo.ru/forum/viewtopic.php?p=188196&sid=3564b6effe75d85c5526211453ddb860#188196"

#property indicator_chart_window
#property indicator_buffers 2
#property indicator_color1 Blue
#property indicator_color2 Blue
//---- input parameters
extern int       RangePeriod=10;
extern int       SmoothPeriod=100;
extern int       SmoothMode=MODE_SMA;
//---- buffers
double ExtMapBuffer1[];
double ExtMapBuffer2[];
double ExtMapBuffer3[];
double ExtMapBuffer4[];

//+------------------------------------------------------------------+
//| Custom indicator initialization function                         |
//+------------------------------------------------------------------+
int init()
  {
//---- indicators
   IndicatorBuffers(4);
   SetIndexStyle(0,DRAW_LINE);
   SetIndexBuffer(0,ExtMapBuffer1);
   SetIndexDrawBegin(0,SmoothPeriod);
   SetIndexStyle(1,DRAW_LINE);
   SetIndexBuffer(1,ExtMapBuffer2);
   SetIndexDrawBegin(1,SmoothPeriod);
   SetIndexBuffer(2,ExtMapBuffer3);
   SetIndexBuffer(3,ExtMapBuffer4);

//----
   return(0);
  }
//+------------------------------------------------------------------+
//| Custom indicator deinitialization function                       |
//+------------------------------------------------------------------+
int deinit()
  {
//----

//----
   return(0);
  }
//+------------------------------------------------------------------+
//| Custom indicator iteration function                              |
//+------------------------------------------------------------------+
int start()
  {
   int    counted_bars=IndicatorCounted();
//----
   int limit,limit1,cnt;
   if (counted_bars==0)
      {
      limit=Bars-RangePeriod;
      limit1=limit-SmoothPeriod;
      }
   if (counted_bars>0)
      {
      limit=Bars-counted_bars;
      limit1=limit;
      }
   limit--;
   limit1--;
   for (cnt=limit; cnt>=0;cnt--)
      {
      ExtMapBuffer3[cnt]=High[Highest(NULL,0,MODE_HIGH,RangePeriod,cnt)];
      ExtMapBuffer4[cnt]=Low[Lowest(NULL,0,MODE_LOW,RangePeriod,cnt)];
      }
   for (cnt=limit1; cnt>=0;cnt--)
      {
      ExtMapBuffer1[cnt]=iMAOnArray(ExtMapBuffer3,0,SmoothPeriod,0,SmoothMode,cnt);
      ExtMapBuffer2[cnt]=iMAOnArray(ExtMapBuffer4,0,SmoothPeriod,0,SmoothMode,cnt);
      }

//----
   return(0);
  }
//+------------------------------------------------------------------+
Comments