Coppock
Download script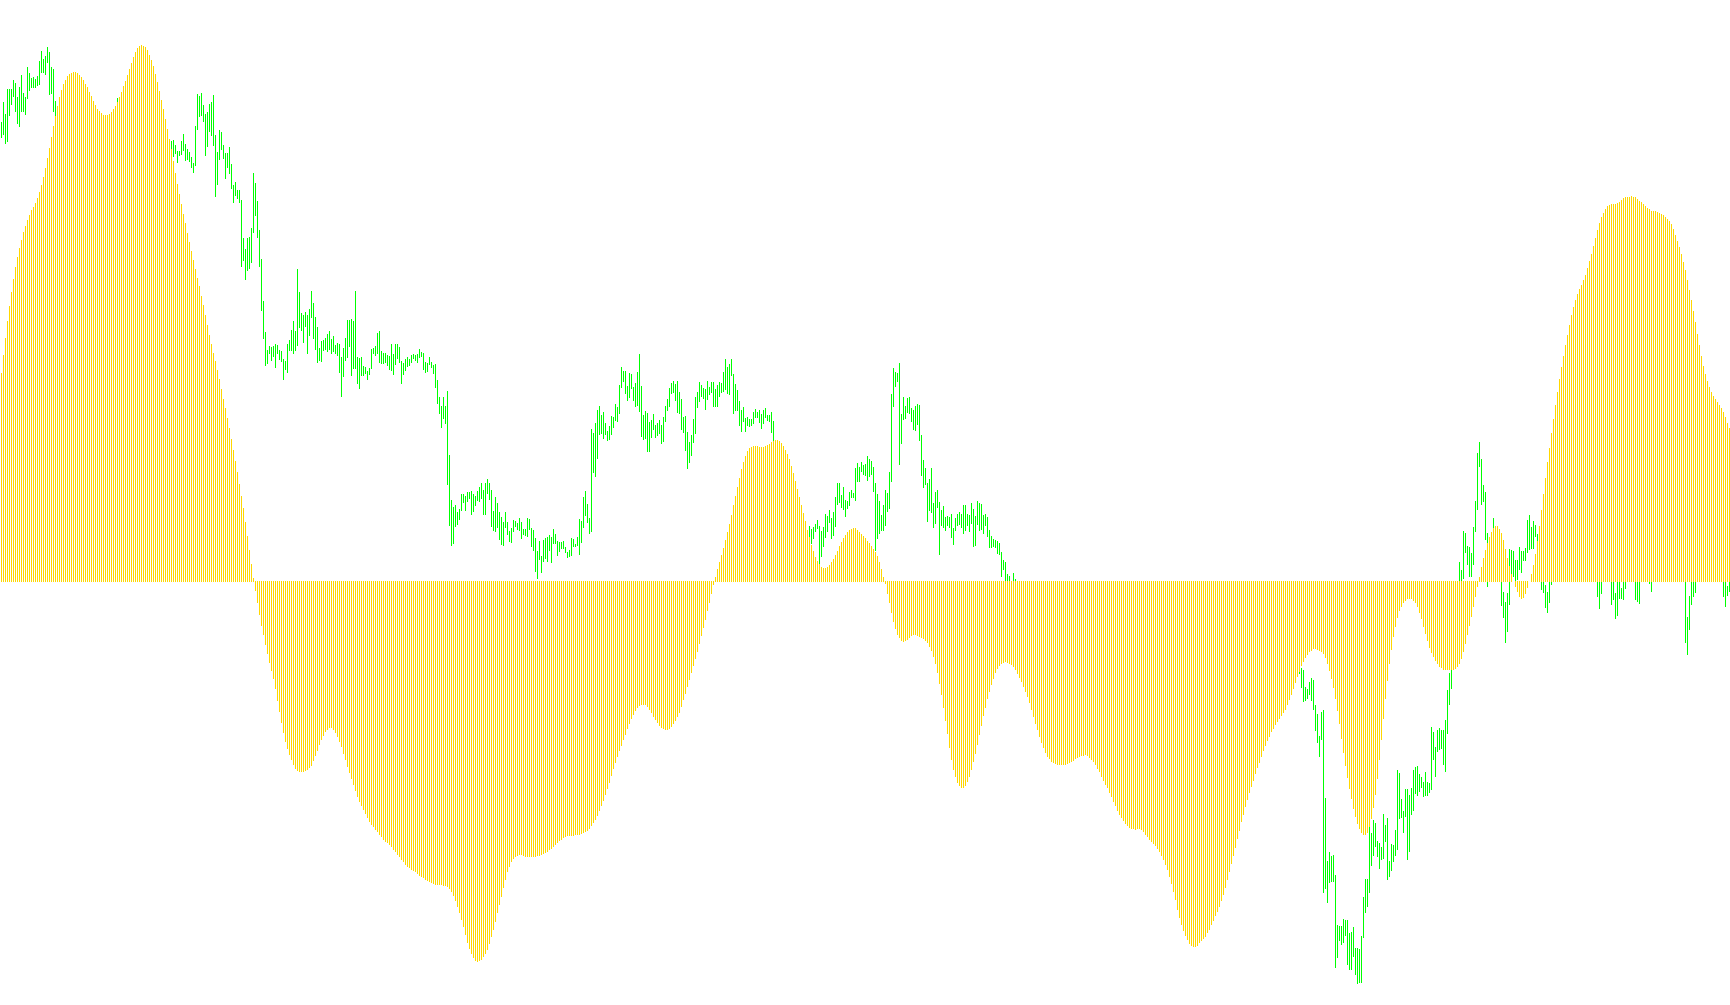
This tool is a technical analysis indicator designed to help traders identify long-term momentum trends in the financial markets. It operates by smoothing out price fluctuations to highlight the underlying "pulse" of the market, making it easier to distinguish between temporary noise and sustained movements.
How the Logic Works
The script follows a multi-step mathematical process to filter out volatility and provide a clearer picture of market direction:
1. Establishing Rate of Change (ROC) Instead of looking at price changes over very short intervals, the logic calculates the difference between two different moving averages.
- It identifies a long-term average (the "slow" trend).
- It identifies a short-term average (the "fast" trend).
- By subtracting the previous values of these averages from their current values, the tool determines the "Rate of Change." This tells the trader how much momentum has built up over specific timeframes.
2. Dual-Layer Momentum Tracking The script performs this Rate of Change calculation twice using two different periods. By calculating both a slow-moving momentum and a fast-moving momentum simultaneously, it ensures that the indicator captures both the broad market trend and more immediate shifts in sentiment.
3. Aggregation and Smoothing Once the momentum from both periods is calculated, the script combines them into a single value. To prevent this combined value from jumping around erratically (which can lead to false signals), it applies one final smoothing layer—a Moving Average. This creates the final visual output, which represents a stabilized view of market momentum.
4. Visual Output The result is displayed as a histogram in a separate window.
- When the values are moving upward, it suggests positive momentum.
- When the values move downward, it suggests negative momentum.
Key Customizations
The tool allows users to fine-tune its sensitivity by adjusting several factors:
- Moving Average Types: Users can choose between different types of averages (Simple, Exponential, Smoothed, or Linear Weighted) to change how quickly the indicator reacts to new price data.
- Lookback Periods: The periods can be adjusted to make the tool more sensitive to short-term swings or more focused on long-term cycles.
- Percentage Mode: There is an option to view the results as a percentage of growth, which helps in comparing different assets that may have vastly different price points.
//+------------------------------------------------------------------+
//|                                                     Coppock .mq4 |
//|                                    Copyright © 2007, Robert Hill |
//+------------------------------------------------------------------+
#property  copyright "Copyright © 2007, Robert Hill"
//---- indicator settings
#property  indicator_separate_window
#property  indicator_buffers 1
#property  indicator_color1  Red
//---- indicator parameters
extern string  strROC="ROC Period for lookback";
extern int     RPeriod1=80;
extern string  strType1="Moving Average Types" ;
extern string  str10="0 = SMA, 1 = EMA";
extern string  str11="2 = SMMA, 3 = LWMA";
extern int     RMAMode1=0;
extern string  ____="----------------------------------";
extern int     RPeriod2=10;
extern string  strType2="Moving Average Types" ;
extern string  str20="0 = SMA, 1 = EMA";
extern string  str21="2 = SMMA, 3 = LWMA";
extern int     RMAMode2=0;
extern string  _____="----------------------------------";
extern string  strMA="MA input parameters";
extern int     MAPeriod=20;
extern string  strType="Moving Average Types" ;
extern string  strm0="0 = SMA, 1 = EMA";
extern string  strm1="2 = SMMA, 3 = LWMA";
extern int     MAType=0;
extern string  ___="----------------------------------";
extern bool    UsePercent=false;
//---- indicator buffers
double     Coppock[];
double     RateOfChange1[];
double     RateOfChange2[];
double     RateOfChange3[];
//---- variables
int    MAMode;
string strMAType;
//+------------------------------------------------------------------+
//| Custom indicator initialization function                         |
//+------------------------------------------------------------------+
int init()
  {
//---- drawing settings
   IndicatorBuffers(4);
   SetIndexStyle(0,DRAW_HISTOGRAM);
   SetIndexDrawBegin(0,MAPeriod);
   IndicatorDigits(MarketInfo(Symbol(),MODE_DIGITS)+1);
//---- indicator buffers mapping
   SetIndexBuffer(0,Coppock);
   SetIndexBuffer(1,RateOfChange1);
   SetIndexBuffer(2,RateOfChange2);
   SetIndexBuffer(3,RateOfChange3);
   switch(MAType)
     {
      case 1: strMAType="EMA"; MAMode=MODE_EMA; break;
      case 2: strMAType="SMMA"; MAMode=MODE_SMMA; break;
      case 3: strMAType="LWMA"; MAMode=MODE_LWMA; break;
      default: strMAType="SMA"; MAMode=MODE_SMA; break;
     }
   IndicatorShortName( "Coppock (" + RPeriod1 + "," + RPeriod2 + ") " + strMAType+ " (" +MAPeriod + ") ");
//---- name for DataWindow and indicator subwindow label
   SetIndexLabel(0,"Coppock");
//---- initialization done
   return(0);
  }
//+------------------------------------------------------------------+
//| Coppock                                                          |
//+------------------------------------------------------------------+
int start()
  {
   int limit, i;
   double MA_Cur1, MA_Prev1;
   double MA_Cur2, MA_Prev2;
   double ROC1, ROC2;
   int counted_bars=IndicatorCounted();
//---- check for possible errors
   if(counted_bars<0) return(-1);
//---- last counted bar will be recounted
   if(counted_bars>0) counted_bars--;
   limit=Bars-counted_bars;
//---- ROC calculations
   for( i=0; i<limit; i++)
     {
      MA_Cur1=iMA(NULL,0,RPeriod1,0,RMAMode1, PRICE_CLOSE,i);
      MA_Prev1=iMA(NULL,0,RPeriod1,0,RMAMode1, PRICE_CLOSE,i+RPeriod1);
      MA_Cur2=iMA(NULL,0,RPeriod2,0,RMAMode2, PRICE_CLOSE,i);
      MA_Prev2=iMA(NULL,0,RPeriod2,0,RMAMode2, PRICE_CLOSE,i+RPeriod2);
      ROC1=MA_Cur1-MA_Prev1;
      ROC2=MA_Cur2-MA_Prev2;
      if (UsePercent)
        {
         RateOfChange1[i]=NormalizeDouble(100 * ROC1/MA_Prev1, 3);
         RateOfChange2[i]=NormalizeDouble(100 * ROC2/MA_Prev2, 3);
        }
      else
        {
         RateOfChange1[i]=NormalizeDouble(ROC1/Point,1);
         RateOfChange2[i]=NormalizeDouble(ROC2/Point,1);
        }
      RateOfChange3[i]=RateOfChange1[i] + RateOfChange2[i];
     }
   for( i=0; i<limit; i++)
     {
      Coppock[i]=iMAOnArray(RateOfChange3,0,MAPeriod,0,MAMode,i);
     }
//---- done
   return(0);
  }
//+------------------------------------------------------------------+
Comments