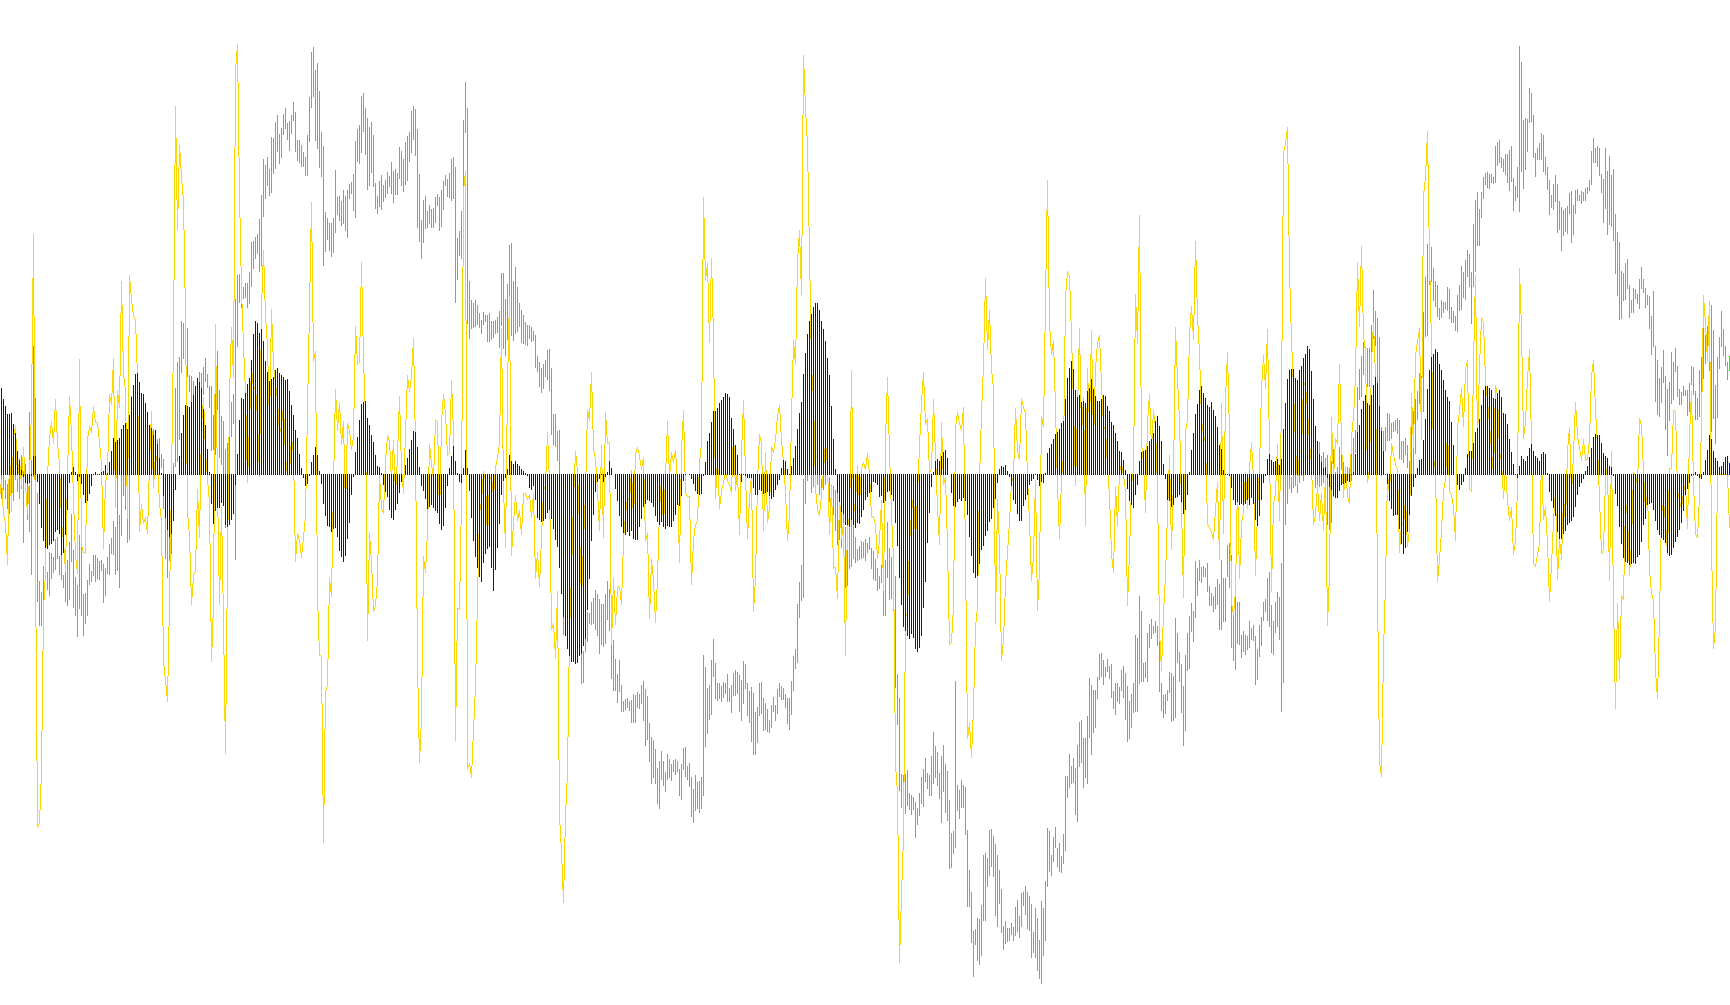
This tool is designed to help traders visualize the relationship between the current market price and its historical average, specifically highlighting how much the price has deviated from that trend over time. It provides a dual-layered visual analysis by combining two distinct mathematical concepts: price deviation and momentum smoothing.
How it works
1. Measuring the Price Gap (Deviation) The script first looks at the current market price and compares it to a "Moving Average"—which is essentially a calculated average of past prices over a specific timeframe. Instead of just showing you the average, the script calculates the raw distance between the current price and that average.
Think of this like measuring how far a runner has strayed from their planned path. If the price is significantly higher than the average, the gap is large; if it is lower, the gap is smaller or negative. This creates a primary data set of "deviations."
2. Smoothing the Trend (Momentum) Because raw price deviations can be very jumpy and volatile from one minute to the next, the script applies a second layer of logic. It takes all those individual "gap" measurements and calculates a secondary average of them.
This smoothing process helps filter out the "noise" of minor market fluctuations, making it easier for a trader to see the broader direction of the price movement. It transforms erratic jumps into a more readable flow.
Visual Representation
The indicator displays this information in a separate window below your main price chart using two different visual styles:
- The Deviation Line: This shows the direct distance between the current price and the moving average. It helps you see exactly how "stretched" the market is at any given moment.
- The Histogram: This represents the smoothed average of those deviations. By looking at the height and direction of these bars, you can get a clearer sense of whether the underlying momentum is strengthening or weakening over time.
Summary for the Trader
In short, this script helps you identify when the market is moving aggressively away from its norm. By providing both the "raw" distance (the line) and the "smoothed" trend (the histogram), it allows you to see not just how far the price has moved, but whether that movement has consistent strength or is simply a temporary spike.
//+------------------------------------------------------------------+
//|                                                       ROC_MA.mq4 |
//|                      Copyright © 2007, MetaQuotes Software Corp. |
//|                                                  Hartono Setiono |
//+------------------------------------------------------------------+
#property copyright "Copyright © 2007, MetaQuotes Software Corp."
#property link      "http://www.metaquotes.net"

#property indicator_separate_window
#property indicator_buffers 2
#property indicator_color1 Red
#property indicator_color2 Lime
//---- input parameters
extern int       MATimeFrame=0;
extern int       MAPeriod=7;
extern int       MAMethod=MODE_SMA;
extern int       MAAppliedPrice=PRICE_CLOSE;
extern int       ROCPeriod=14;
extern int       ROCMethod=MODE_SMA;

//---- buffers
double ExtMapBuffer1[];
double ExtMapBuffer2[];
//+------------------------------------------------------------------+
//| Custom indicator initialization function                         |
//+------------------------------------------------------------------+
int init()
  {
//---- indicators
   SetIndexStyle(0,DRAW_LINE);
   SetIndexBuffer(0,ExtMapBuffer1);
   SetIndexStyle(1,DRAW_HISTOGRAM);
   SetIndexBuffer(1,ExtMapBuffer2);
//----
   return(0);
  }
//+------------------------------------------------------------------+
//| Custom indicator deinitialization function                       |
//+------------------------------------------------------------------+
int deinit()
  {
//----

//----
   return(0);
  }
//+------------------------------------------------------------------+
//| Custom indicator iteration function                              |
//+------------------------------------------------------------------+
int start()
  {
   int limit,ExtCountedBars=IndicatorCounted();
   if (ExtCountedBars<0) return(-1);
   if (ExtCountedBars>0) ExtCountedBars--;
   int pos=Bars-ExtCountedBars-1;
   if(pos<MAPeriod) pos=MAPeriod;

   limit=pos;
   //if(ExtCountedBars<1)
   for(int i=1;i<MAPeriod;i++,pos--) {ExtMapBuffer1[pos]=0; ExtMapBuffer2[pos]=0;}

   while(pos>=0)
     {
       double maVal=iMA(NULL,MATimeFrame,MAPeriod,0,MAMethod,MAAppliedPrice,pos);
       ExtMapBuffer1[pos]=(Close[pos] - maVal)/Point;
       pos--;
     }

   for(i=limit; i>0; i--)
   {
     ExtMapBuffer2[i]=iMAOnArray(ExtMapBuffer1,0,ROCPeriod,0,ROCMethod,i);
   }
   return(0);
  }
//+------------------------------------------------------------------+
Comments