corelation
Download script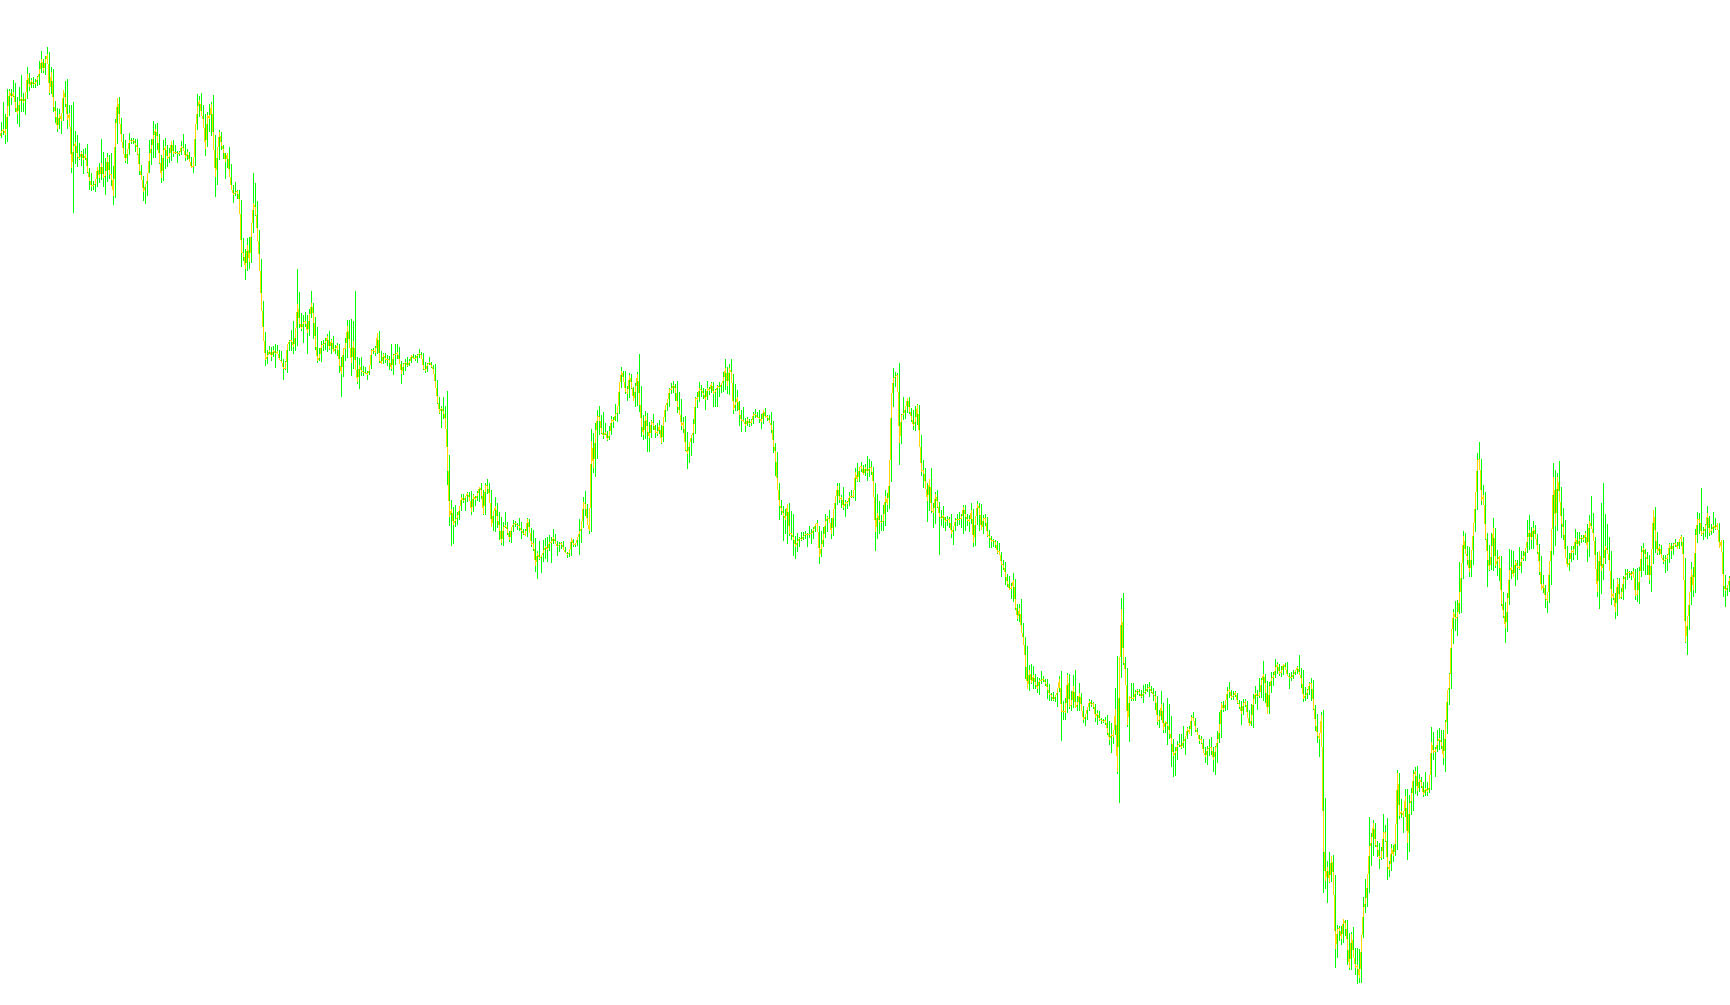
This tool is designed to help traders visualize the relationship between two different financial assets—such as currencies, commodities, or stocks—on a single chart. By overlaying one instrument on top of another, it allows you to see how they move in relation to each other, making it easier to identify patterns of correlation, synchronization, or divergence.
How the Logic Works
The core challenge when comparing two different assets (e.g., Gold vs. EUR/USD) is that they trade at vastly different price levels. This script solves that problem by performing an automated mathematical alignment.
1. Dynamic Scaling and Alignment Instead of simply plotting the prices, the script looks back at a specific amount of historical data (which you can define). It identifies the highest and lowest price points for both instruments within that timeframe. It then calculates a "scaling factor" to shrink or stretch the secondary instrument so that it fits perfectly into the price range of your main chart. This ensures that both assets are visually comparable on the same screen without the data being flattened or lost.
2. Inversion Capability Sometimes, two assets move in opposite directions (an inverse correlation). The script includes a feature to "flip" the secondary chart upside down. This is useful for seeing if a price drop in one asset consistently aligns with a price rise in another, allowing you to view them as moving in the same direction visually.
3. Trend and Smoothing Options To help filter out market "noise," the script includes built-in functionality for Moving Averages (MA). You can choose to view:
- The raw price action of the secondary instrument.
- A smoothed Moving Average line to highlight the general trend.
- The Moving Average exclusively, which hides the raw price to provide a cleaner view of the trend correlation.
Key Features for the User
- Customizable Scope: You can choose how many historical bars the script should use to calculate the alignment, allowing you to focus on recent trends or broader historical movements.
- Visual Clarity: By automatically adjusting offsets and scales, the tool removes the manual work of trying to "line up" two different charts, providing a seamless visual experience.
- Comparative Analysis: It provides an immediate visual answer to whether two assets are moving together, providing a valuable layer of analysis for diversifying a portfolio or identifying hedging opportunities.
//+---------------------------------------------------------------------------------+
//|                                                   corelation.mq4                |
//|                                Copyright © 2008, Borys Chekmasov                |
//|                                     http://uatrader.blogspot.com                |
//+---------------------------------------------------------------------------------+
// Èíäèêàòîð ïðåäíàçíà÷åí äëÿ ïîèñêà êîðåëÿöèé ìåæäó ðàçëè÷íûìè èñòðóìåíòàìè        |
// Ïîçâîëÿåò íàêëàäûâàòü ãðàôèê îäíîãî èíñòðóìåíòà ïîâåðõ äðóãîãî                   |
// Âõîäíûå ïàðàìåòðû:
// simbol_name - òèêåð êîòîðûé íàêëàäûâàåòñÿ íà ãðàôèê
// bars_for_autoscale - êîëè÷åñòâî áàðîâ, ïî êîòîðûì ïðîèçâîäèòñÿ ìàññøòàáèðîâàíèå
// åñëè íîëü, òî ìàêñèìàëüíîå êîëè÷åñòâî áàðîâ
// inverse - ïåðåâîðà÷èâàåò ãðàôèê ââåðõ íîãàìè
// MA - ïîêàçûâàòü èëè íåò ñêîëüçÿùóþ ñðåäíþþ äëÿ íàêëàäûâàåìîãî ãðàôèêà
// MAPeriod - ïåðèîä ñêîëüçÿùåé ñðåäíåé
// MAOnly - ïîêàçûâàòü òîëüêî ñêîëüçÿùóþ ñðåäíþþ (ñêðûâàåò ãðàôèê)
#property copyright "Copyright © 2008, Borys Chekmasov"
#property link      "http://uatrader.blogspot.com"

#property indicator_chart_window
#property indicator_buffers 2
#property indicator_color1 Gold
#property indicator_color2 DodgerBlue
//âõîäíûå ïàðàìåòðû
extern string simbol_name = "EURUSD";
extern int bars_for_autoscale = 200;
extern bool inverse = false;
extern bool MA = false;
extern int MAPeriod =14;
extern bool MAOnly = false;

double simbolBuffer[];
double MABuffer[];

// èíèöèàëèçàöèÿ
int init()
  {
   SetIndexBuffer(0,simbolBuffer);
   SetIndexStyle (0,DRAW_LINE);
      SetIndexBuffer(1,MABuffer);
   SetIndexStyle (1,DRAW_LINE);
   return (0);
  }

//îñíîâíîé öèêë

int start()
  {
double simbol_scale = 1;
double simbol_offset = 0;
 int i,k;
int cb=IndicatorCounted();
i = Bars-cb-1;
k = bars_for_autoscale;
if (bars_for_autoscale==0) k=Bars;
double max_scale=iClose(simbol_name,0,1);
double min_scale=iClose(simbol_name,0,1);
double max_scale2=Close[1];
double min_scale2=Close[1];
while(k>=0)
      {

      if (max_scale<iClose(simbol_name,0,k)) max_scale=iClose(simbol_name,0,k);
      if (min_scale>iClose(simbol_name,0,k)) min_scale=iClose(simbol_name,0,k);
      if (max_scale2<Close[k])max_scale2=Close[k];
      if (min_scale2>Close[k])min_scale2=Close[k];


      k--;
      }

simbol_scale = (max_scale2 - min_scale2)/(max_scale-min_scale);
      if(!inverse) {
 simbol_offset = max_scale2 - simbol_scale*max_scale;
 }
 else
 {
 simbol_offset = max_scale2 + simbol_scale*min_scale;
 }

while(i>=0)
      {

        if(!inverse)
        {
         if (!MAOnly) simbolBuffer[i]=simbol_scale*(iClose(simbol_name,0,i))+simbol_offset;
         if (MA)MABuffer[i]=(iMA(simbol_name,0,MAPeriod,0,0,PRICE_CLOSE,i))*simbol_scale+simbol_offset;
         }
        else
        {
        if (!MAOnly) simbolBuffer[i]=simbol_offset - simbol_scale*(iClose(simbol_name,0,i));
        if (MA)MABuffer[i]=simbol_offset - simbol_scale*(iMA(simbol_name,0,MAPeriod,0,0,PRICE_CLOSE,i));
        }
          i--;
      }


   return(0);
  }
Comments