EMA_levels_v1
Download script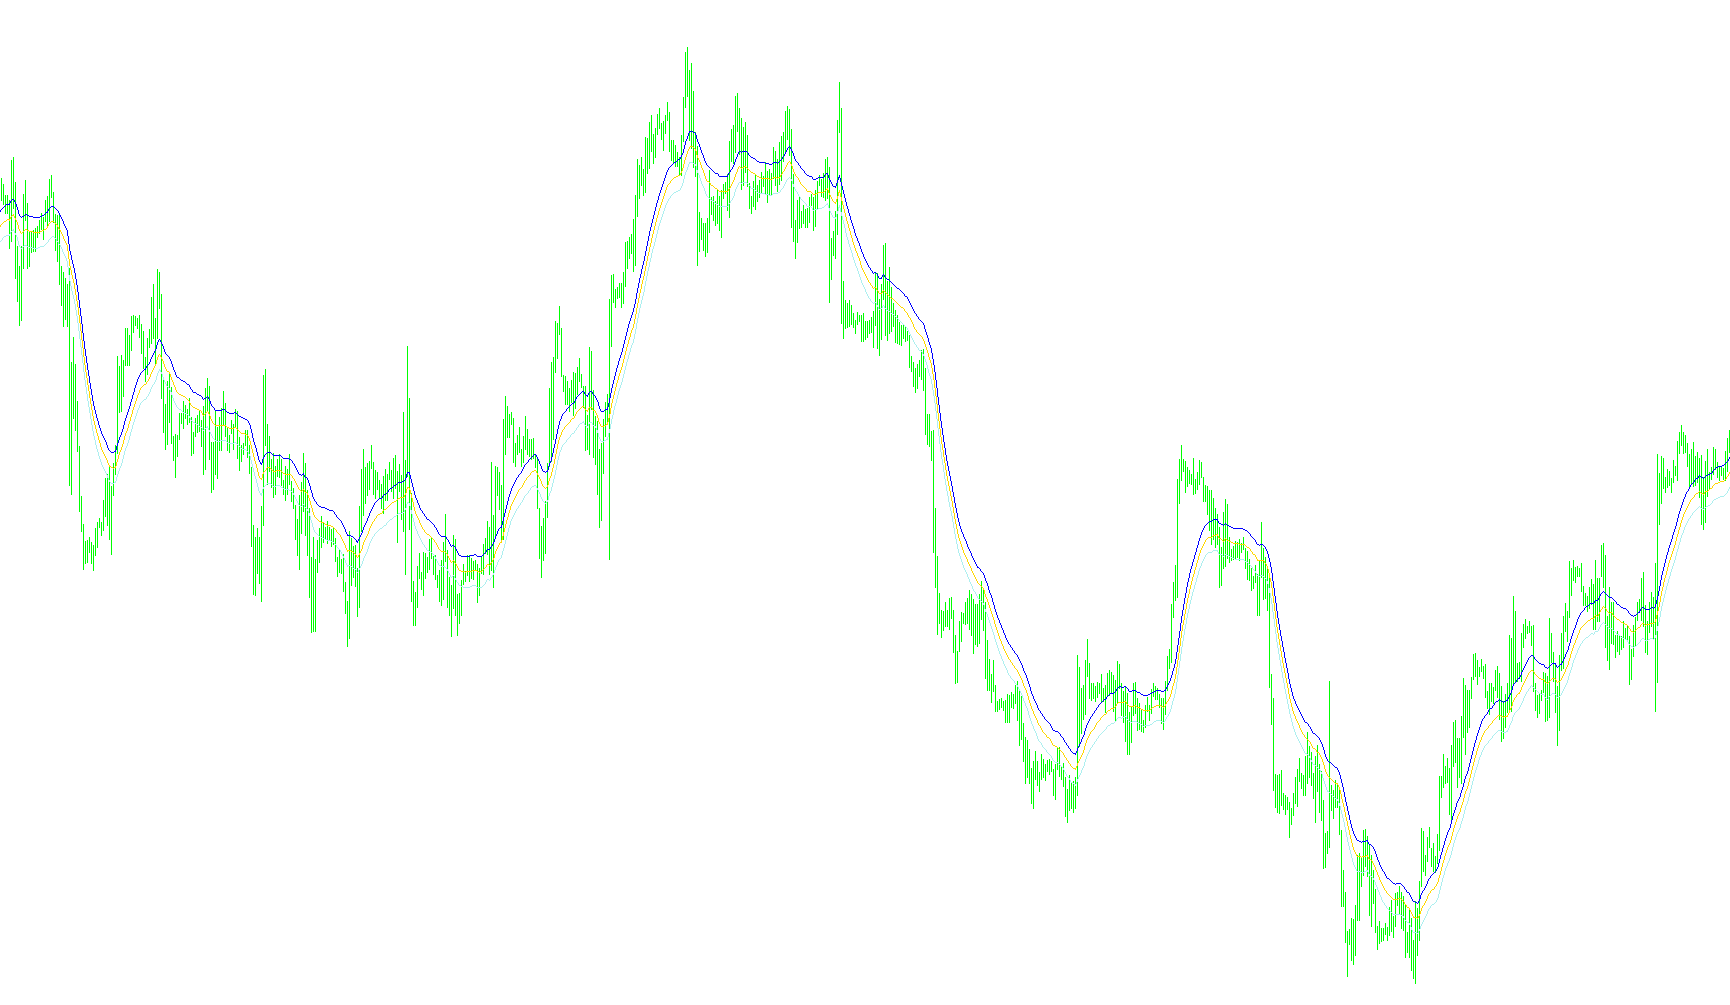
This tool is designed to provide traders with a visual map of market trends by identifying central momentum and specific price boundaries on a trading chart. It simplifies complex price movements into three distinct components: a primary trend line and two surrounding "bands" that represent potential zones of interest.
Core Logic and Functionality
The indicator operates using a three-layer logic system to help users visualize price direction and volatility:
- The Trend Line (Center): At the heart of the tool is a moving average calculation. This acts as the "equilibrium" or the current primary trend of the market. It smooths out minor price fluctuations to reveal whether the overall direction is moving upward, downward, or sideways.
- The Upper and Lower Bands: The script creates two additional lines—one above and one below the central trend line. These bands are set at a fixed distance from the center. Think of these as "guardrails." They help traders identify when the price might be overextending itself relative to its average path.
- Dynamic Positioning: Because these bands are tied directly to the moving average, they move in tandem with the market. If the central trend line climbs, both the upper and lower bands rise with it; if the trend drops, they follow downward. This ensures that the "safe zones" remain relevant regardless of how high or low the price moves.
How it Visualizes Market Behavior
By observing the relationship between the price candles and these three lines, a trader can interpret the market in several ways:
- Trend Identification: When the price stays consistently above the center line and the bands are sloping upward, it indicates a bullish trend. Conversely, price staying below the center line with a downward slope suggests a bearish trend.
- Price Extremes: When the price reaches or breaks out of the upper or lower bands, it often signals that the market is reaching an extreme point. Traders use this to identify areas where the market might be "stretched" and could potentially pull back toward the center line.
- Stability Check: The space between the upper and lower bands provides a visual representation of the market's current "breathing room."
In summary, this script transforms raw price data into a structured visual framework, allowing you to see the "main road" of the market while clearly marking the boundaries of normal price fluctuations.
/*-----------------------------+
|			       |
| Shared by www.Aptrafx.com    |
|			       |
+------------------------------*/

//+------------------------------------------------------------------+
//|                                                  EMABands_v1.mq4 |
//|                                  Copyright © 2006, Forex-TSD.com |
//|                         Written by IgorAD,igorad2003@yahoo.co.uk |
//|            http://finance.groups.yahoo.com/group/TrendLaboratory |
//+------------------------------------------------------------------+
#property copyright "Copyright © 2006, Forex-TSD.com "
#property link      "http://www.forex-tsd.com/"

#property indicator_chart_window
#property indicator_buffers 4
#property indicator_color1 Blue
#property indicator_color2 Silver
#property indicator_color3 Silver

//---- input parameters
extern int RPeriod=25;
extern int MA_mode=1;
extern int OffSet=40;

//---- indicator buffers
double MABuffer[];
double UpBuffer[];
double DnBuffer[];

//+------------------------------------------------------------------+
//| Custom indicator initialization function                         |
//+------------------------------------------------------------------+
  int init()
  {
   string short_name;
//---- indicator line
   SetIndexStyle(0,DRAW_LINE);
   SetIndexStyle(1,DRAW_LINE);
   SetIndexStyle(2,DRAW_LINE);

   SetIndexBuffer(0,MABuffer);
   SetIndexBuffer(1,UpBuffer);
   SetIndexBuffer(2,DnBuffer);
//---- name for DataWindow and indicator subwindow label
   short_name="EMA_levels("+RPeriod+")";
   IndicatorShortName(short_name);
   SetIndexLabel(0,"MA");
   SetIndexLabel(1,"Up");
   SetIndexLabel(2,"Dn");
//----
   SetIndexDrawBegin(0,RPeriod);
   SetIndexDrawBegin(1,RPeriod);
   SetIndexDrawBegin(2,RPeriod);

//----
   return(0);
  }

//+------------------------------------------------------------------+
//| EMA_Levels                                                       |
//+------------------------------------------------------------------+
int start()
  {

   int shift,limit, counted_bars=IndicatorCounted();

   if ( counted_bars > 0 )  limit=Bars-counted_bars;
   if ( counted_bars < 0 )  return(0);
   if ( counted_bars ==0 )  limit=Bars-RPeriod-1;

	for(shift=limit;shift>=0;shift--)
   {
   MABuffer[shift] = iMA(NULL,0,RPeriod,0,MA_mode,PRICE_CLOSE,shift);
   UpBuffer[shift] = MABuffer[shift] + OffSet*Point;
   DnBuffer[shift] = MABuffer[shift] - OffSet*Point;
	}
	return(0);
 }
Comments