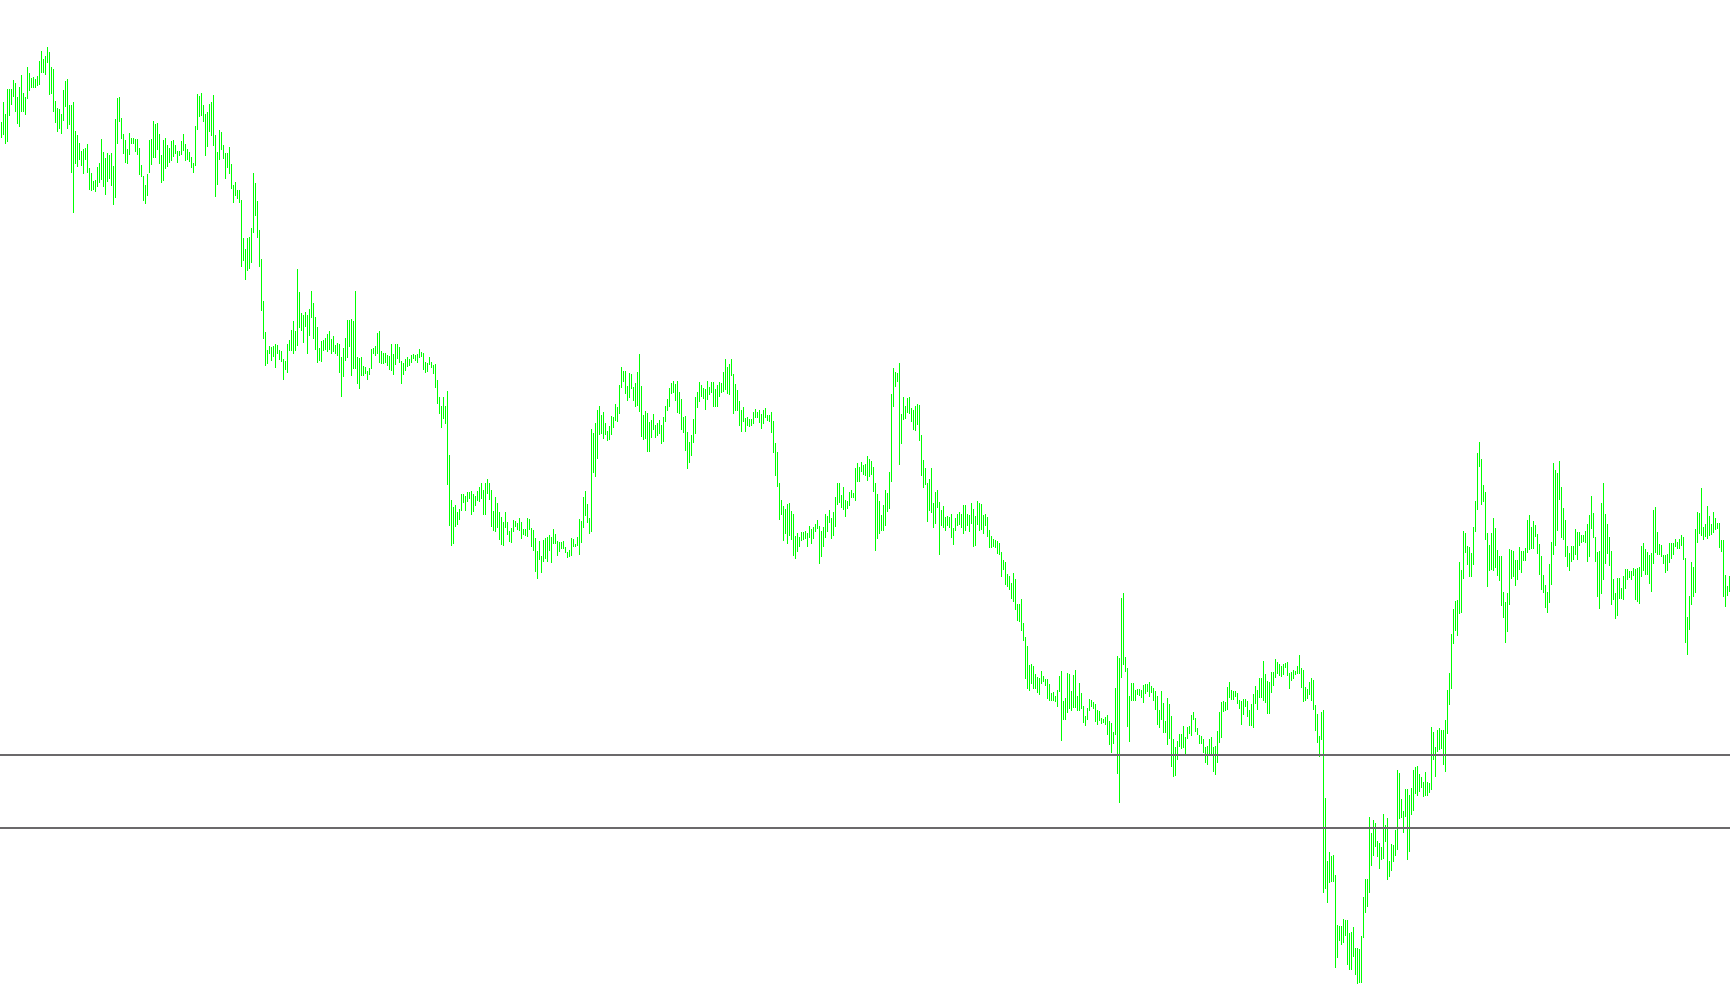
This script is designed to provide traders with a clear visual representation of the daily price boundaries by automatically identifying and plotting key support and resistance levels based on historical daily data.
How It Works
The primary goal of this tool is to help you identify where the market might face pressure or find a floor based on the previous day's performance. Here is the step-by-step logic it follows:
1. Timeframe Compatibility The script first checks which timeframe your chart is currently set to (e.g., 1-minute, 1-hour, or 4-hour charts). It is specifically designed for intraday use and includes a safety check to ensure the chart period is not set larger than one day.
2. Daily Data Retrieval Regardless of what timeframe you are viewing, the script "looks back" at the Daily (D1) price data. It captures the specific price movements—such as highs, lows, and closing prices—from the previous trading day to use as a reference for your current session.
3. Calculating the Pivot Point The core logic involves calculating a central equilibrium point (the "X" value) from the previous day's price action. The script looks at several different price points from yesterday to determine if the market was trending upward, downward, or moving sideways:
- If the market closed lower than it opened, it uses a specific average of the day's movement.
- If the market closed higher than it opened, it uses a different weighted average.
- If the market finished at the same price it started, it applies a neutral calculation.
4. Determining Support and Resistance Once the central equilibrium point is established, the script calculates two specific levels:
- Resistance: The price level above the center where the market may struggle to break through.
- Support: The price level below the center where the market may find a "floor."
5. Visual Display Finally, the script automatically draws two horizontal lines on your chart (labeled "DRes line" and "DSup line").
- These lines are colored in a subtle DimGray to keep your chart clean.
- They are updated dynamically so that as new data comes in, the levels remain accurate relative to the daily price action.
Summary for the Trader
Instead of manually calculating where the previous day's volatility might leave "scars" on the current day's price, this script does the math for you. It provides two clear horizontal boundaries that act as visual guides for your entries and exits, helping you identify potential areas of reversal or breakout based on yesterday’s price geometry.
//+------------------------------------------------------------------+
//|                                                  Daily range.mq4 |
//|                                                         mishanya |
//|                                           www.fxtradercenter.com |
//+------------------------------------------------------------------+
#property copyright "mishanya"
#property link      "www.fxtradercenter.com"

#property indicator_chart_window

extern int StepBack=0;

double X,rates_d1[][6],sup,res;
int timeshift=0, timeshifts=0, beginner=0,d;
int periods;


//+------------------------------------------------------------------+
//| Custom indicator initialization function                         |
//+------------------------------------------------------------------+
int init()
  {
//---- indicators
//----
   return(0);
  }
//+------------------------------------------------------------------+
//| Custor indicator deinitialization function                       |
//+------------------------------------------------------------------+
int deinit()
  {
//---- TODO: add your code here
      ObjectDelete("DSup line");
      ObjectDelete("DRes line");
//----
   return(0);
  }
//+------------------------------------------------------------------+
//| Custom indicator iteration function                              |
//+------------------------------------------------------------------+
int start()
  {
   int    counted_bars=IndicatorCounted();
//---- TODO: add your code here

   d=1+StepBack;

   switch (Period())
   {
      case PERIOD_M1:  {timeshifts=60; beginner=Hour()*60;} break;
      case PERIOD_M5:  {timeshifts=300; beginner=Hour()*12;} break;
      case PERIOD_M15: {timeshifts=900; beginner=Hour()*4;} break;
      case PERIOD_M30: {timeshifts=1800; beginner=Hour()*2;} break;
      case PERIOD_H1:  {timeshifts=3600; beginner=Hour()*1;} break;
      case PERIOD_H4:  {timeshifts=14400; beginner=Hour()*0.25;} break;
      case PERIOD_D1:  {timeshifts=86400; beginner=Hour()*0;} break;
    }

   timeshift=timeshifts*24;

   if(Period() > 86400)
      {
         Print("Error - Chart period is greater than 1 day.");
         return(-1); // then exit
      }

   ArrayCopyRates(rates_d1, Symbol(), PERIOD_D1);

   if (rates_d1[d][4]<rates_d1[d][1]) X=(rates_d1[d][3]+rates_d1[d][2]+rates_d1[d][4]+rates_d1[d][2])/2;
   if (rates_d1[d][4]>rates_d1[d][1]) X=(rates_d1[d][3]+rates_d1[d][2]+rates_d1[d][4]+rates_d1[d][3])/2;
   if (rates_d1[d][4]==rates_d1[d][1]) X=(rates_d1[d][3]+rates_d1[d][2]+rates_d1[d][4]+rates_d1[d][4])/2;

   sup = X - rates_d1[d][3];
   res = X - rates_d1[d][2];

   if (ObjectFind("DRes Line") != 0)
     {
      ObjectCreate("DRes line",OBJ_HLINE,0,Time[0],res);
      ObjectSet("DRes line",OBJPROP_COLOR,DimGray);
      ObjectSet("DRes line",OBJPROP_WIDTH,2);
     }
     else
     {
     ObjectMove("DRes line", 0,Time[0],res);
     }

   if (ObjectFind("DSup Line") != 0)
     {
      ObjectCreate("DSup line",OBJ_HLINE,0,Time[0],sup);
      ObjectSet("DSup line",OBJPROP_COLOR,DimGray);
      ObjectSet("DSup line",OBJPROP_WIDTH,2);
     }
     else
     {
     ObjectMove("DSup line", 0,Time[0],sup);
     }


//----
   return(0);
  }
//+------------------------------------------------------------------+
Comments