DailyHighLow_v1
Download script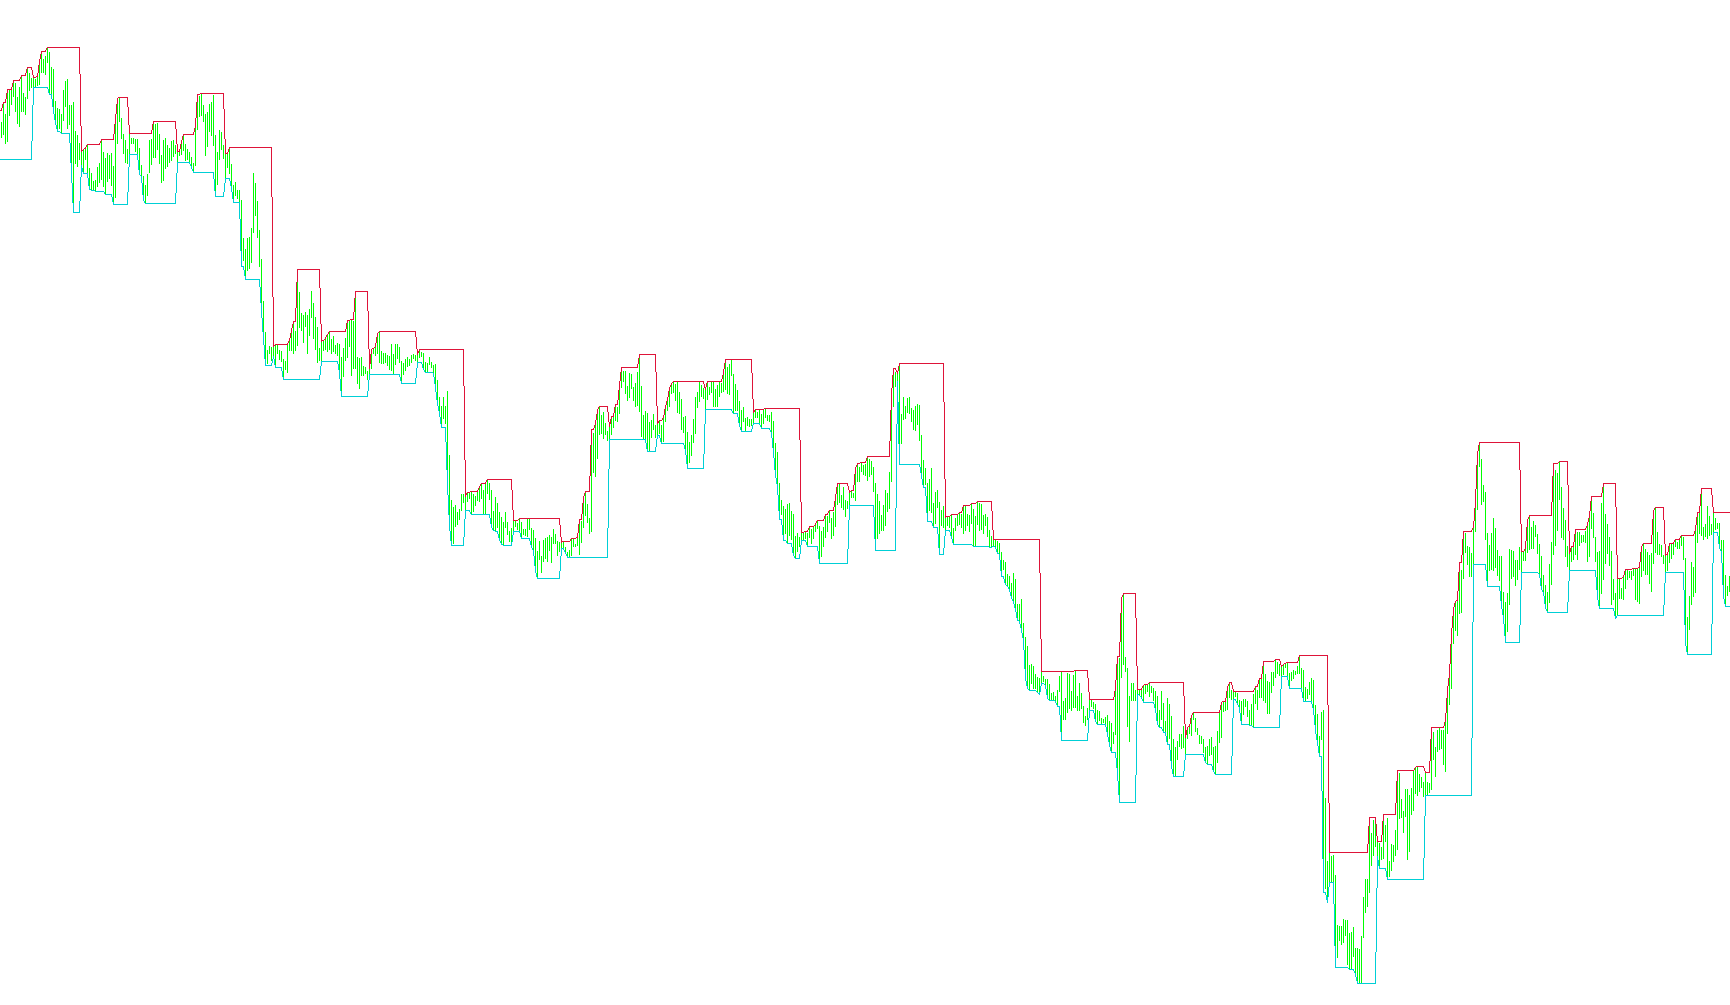
This tool is designed to provide traders with a clear visual representation of the price extremes reached during each trading day. By identifying these key boundaries, it helps you understand the daily range of the market at a glance.
How the Logic Works
The script monitors the price movement across your charts and performs three primary actions:
- Tracking Daily Extremes: The tool continuously scans the price data to identify two specific points for every trading session: the highest price reached (the peak) and the lowest price reached (the trough).
- Dynamic Reset Mechanism: The logic is designed to recognize when a new day begins. Every time the calendar date changes, the script "resets" its memory. It clears the previous day's peaks and valleys and starts tracking the new highs and lows from that exact moment forward.
- Visual Mapping: As the market moves, the script plots two distinct lines on your chart:
- A line representing the Daily High (displayed in Crimson).
- A line representing the Daily Low (displayed in DarkTurquoise).
Practical Application
Instead of having to manually look back at historical data to see where the price peaked or bottomed out yesterday, this tool automatically draws those boundaries for you. It allows you to see exactly how much "room" the market has moved within a 24-hour period, providing a constant reference point for volatility and price action levels.
Miscellaneous
14
Views
0
Downloads
0
Favorites
DailyHighLow_v1
/*-----------------------------+
|			       |
| Shared by www.Aptrafx.com    |
|			       |
+------------------------------*/


//+------------------------------------------------------------------+
//|                                               Daily High Low.mq4 |
//|                                           Copywrong 2005, RonT   |
//|                                 http://www.lightpatch.com/forex/ |
//+------------------------------------------------------------------+
#property copyright "RonT"
#property link      "http://www.lightpatch.com/forex/"

#property indicator_chart_window
#property indicator_buffers 2

double LOBuffer[];
double HIBuffer[];


//+------------------------------------------------------------------+
//| Custor indicator deinitialization function                       |
//+------------------------------------------------------------------+
int deinit()
  {
   return(0);
  }


//+------------------------------------------------------------------+
//| Custom indicator initialization function                         |
//+------------------------------------------------------------------+
int init()
  {
   SetIndexStyle(0,DRAW_LINE,0,1,DarkTurquoise);
   SetIndexBuffer(0,LOBuffer);

   SetIndexStyle(1,DRAW_LINE,0,1,Crimson);
   SetIndexBuffer(1,HIBuffer);

   return(0);
  }


//+------------------------------------------------------------------+
//| Custom indicator iteration function                              |
//+------------------------------------------------------------------+
int start()

  {
   int    counted_bars=IndicatorCounted();
   int    limit, i;

   double dayhigh=0;
   double daylow=999;

   if(counted_bars<0) return(-1);
   limit=(Bars-counted_bars)-1;

   for (i=limit; i>=0;i--)
     {
      if (dayhigh<High[i]) {dayhigh=High[i];}
      if (daylow>Low[i])   {daylow=Low[i];  }

      if (TimeDay(Time[i])!=TimeDay(Time[i+1]))
        {
         // reset limits when day changes
         dayhigh=High[i];
         daylow=Low[i];
        }

      LOBuffer[i]=daylow;
      HIBuffer[i]=dayhigh;

     }
   return(0);
  }
Comments