BenOpenLines
Download script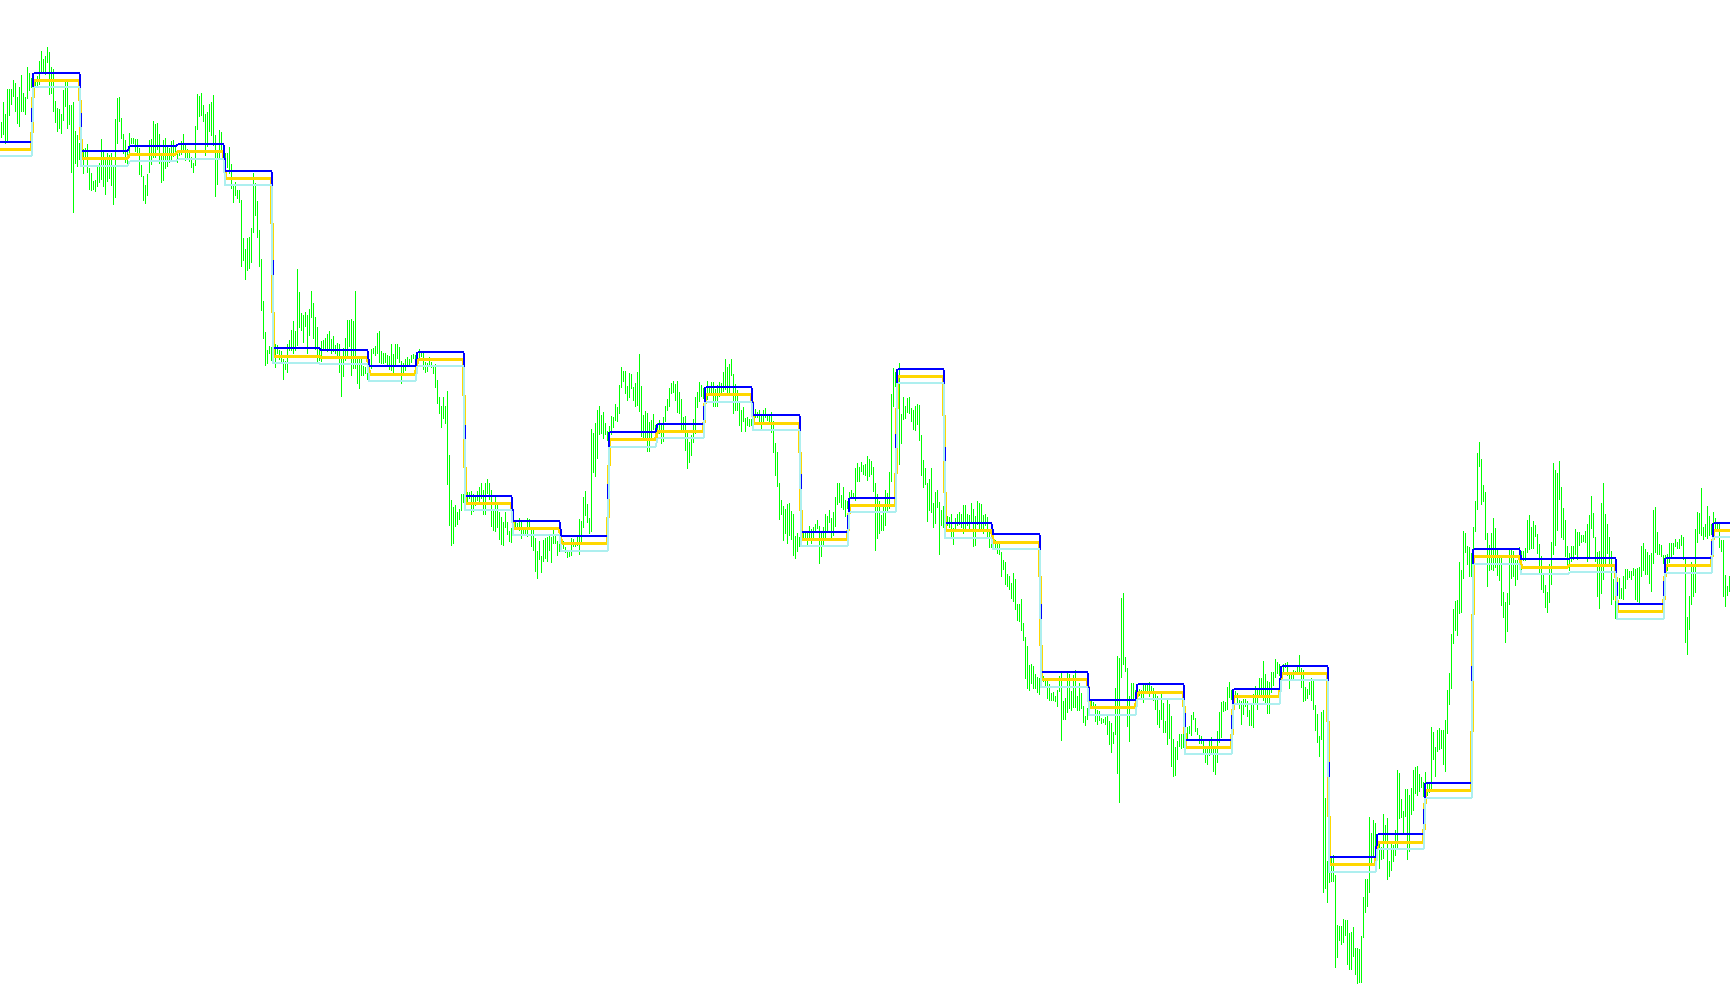
This tool is designed as a visual aid for traders to analyze price action and identify key market levels based on specific time intervals. Instead of relying on complex mathematical formulas, it focuses on tracking the highs and lows reached during specific hours of the trading day.
Core Functionality
The script scans your historical chart data and identifies the boundaries (the highest and lowest prices) reached during a 24-hour cycle. Its primary purpose is to mark significant price zones, helping you visualize where the market has been most active or where it has found resistance and support.
How it Works
- Time Filtering: The indicator monitors the clock and resets its calculations at specific intervals (defined by the "HL_Hours" setting). It tracks every high and low price point that occurs within these time blocks.
- Dynamic Range Identification: As new price data comes in, the script constantly compares current prices against the highest and lowest points of the period. It automatically updates these boundaries to ensure the visual data remains accurate as the market moves.
- Visual Markers: The tool generates three distinct visual components on your chart:
- A reference line that tracks the opening price of the identified period.
- An upper boundary marker, calculated by projecting a specific distance above the opening price.
- A lower boundary marker, projected at an equal distance below the opening price.
Practical Application
For a trader, this script serves as a "map" of the current session. By highlighting these zones, it allows you to see the relationship between the market's opening price and its extreme reaches. It helps in identifying "buffer zones"—the areas above and below the starting price—providing a clearer picture of market volatility and potential reaction points for your trading strategy.
#property indicator_chart_window
#property indicator_buffers 3
#property indicator_color1 Yellow
#property indicator_color2 Lime
#property indicator_color3 Lime


//---- input parameters
static int HL_Hours = 24; //4 = 4 hours
extern int distancefromopen=30;


//---- indicator buffers
double openbuffer[];
double topbuffer[];
double bottombuffer[];


int init()
{

   SetIndexBuffer(0, openbuffer);
   SetIndexStyle(0, DRAW_LINE, 0,3);

   SetIndexStyle(1,DRAW_LINE,STYLE_SOLID, 2);
   SetIndexArrow(1,233);
   SetIndexBuffer(1,topbuffer);
   SetIndexEmptyValue(1,0.0);

   SetIndexStyle(2,DRAW_LINE,STYLE_SOLID, 2);
   SetIndexArrow(2,234);
   SetIndexBuffer(2,bottombuffer);
   SetIndexEmptyValue(2,0.0);


   return(0);
}

int deinit()
{
       ObjectsDeleteAll(0,OBJ_LABEL);

   return(0);
}

int start()
{
   int count, cur_hour, prev_hour = 0;
   double hour_high, hour_low, H, L,O, A = 0;

   if (Period() >= PERIOD_D1) return(0);

   for (count=Bars;count>=0;count--)
   {
      topbuffer[count]=0; bottombuffer[count]=0;
      cur_hour = TimeHour(Time[count]);

      if (prev_hour != cur_hour)
      {
         prev_hour = cur_hour;


if (!MathMod(cur_hour,HL_Hours))
{

            H = hour_high;
            A = (hour_high+hour_low)*0.5;
            L = hour_low;
            O=Open[count];

            hour_high = High[count];
            hour_low = Low[count];
         }
      }

      hour_high = MathMax(hour_high, High[count]);
      hour_low = MathMin(hour_low, Low[count]);

      openbuffer[count]=O;
      topbuffer[count]=O+distancefromopen*Point;
      bottombuffer[count]=O-distancefromopen*Point;


   }


   return(0);
}
Comments