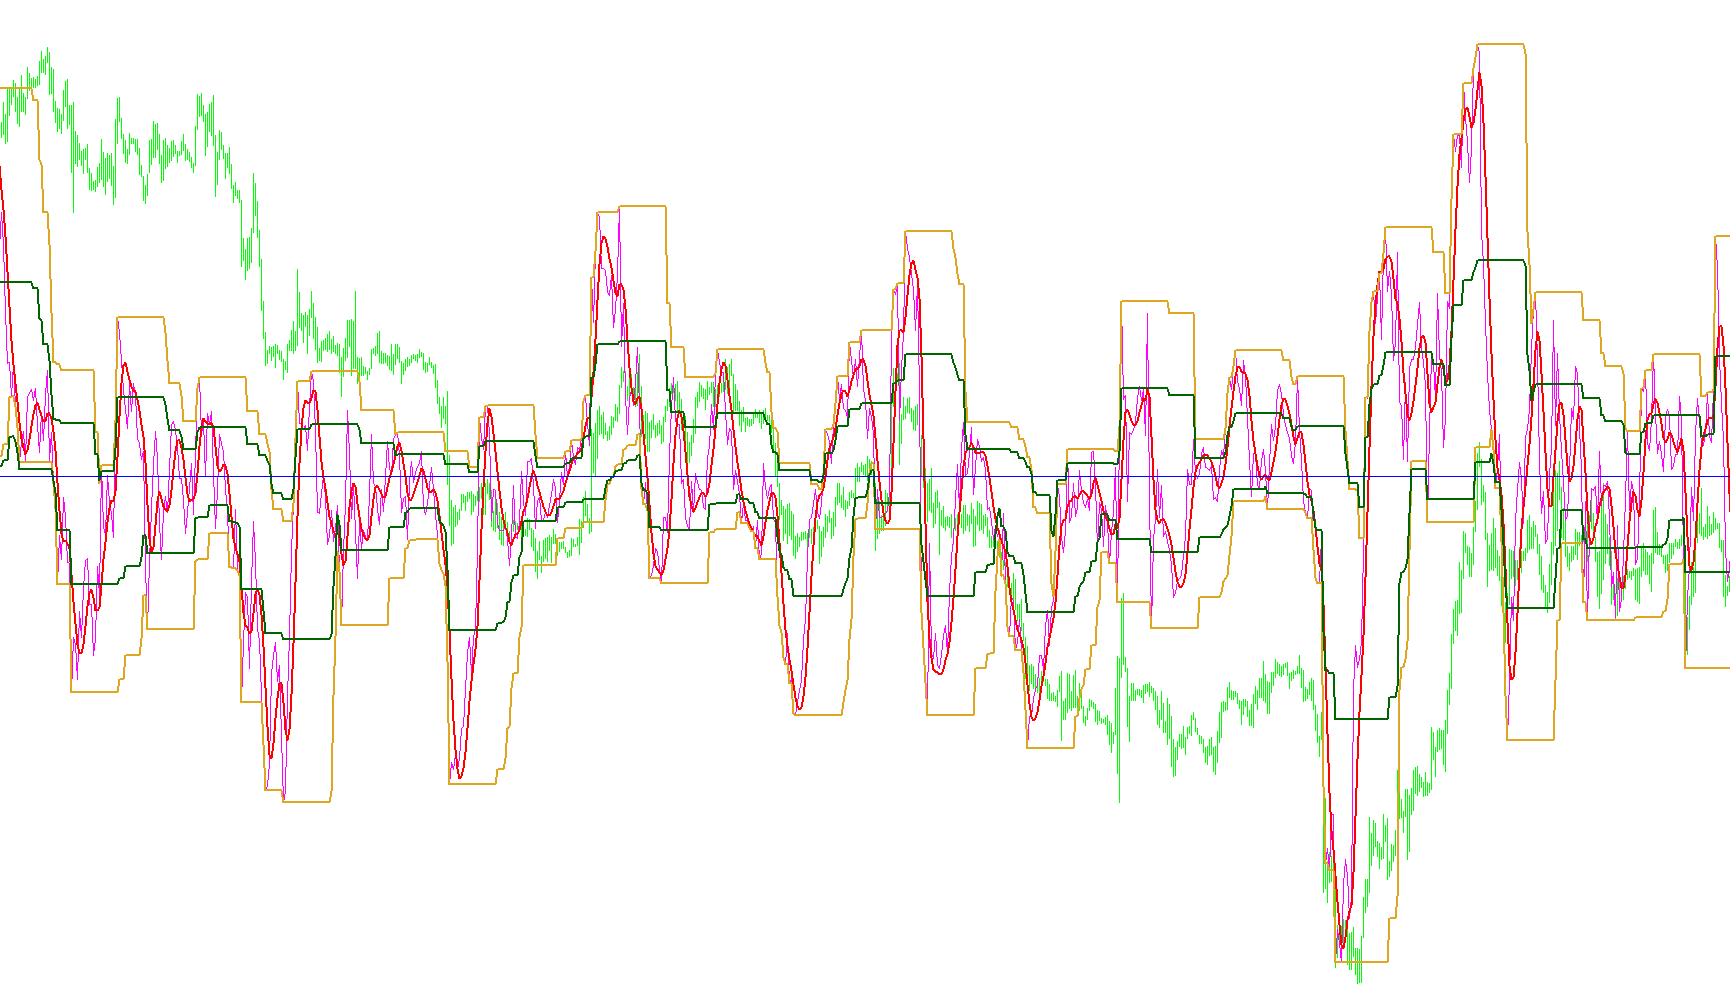
This technical tool is designed to provide a visual representation of market momentum and price volatility on a trading chart. It processes historical price data to generate three distinct types of information: an impulse measurement, a smoothed trend line, and dynamic range channels.
Core Components and Logic
1. The Impulse Calculation (DayImpuls) The primary logic begins by measuring the difference between the opening and closing prices over a specific set of candles. By summing these differences, the script calculates the "momentum" of the market.
- The result is converted into a simplified numerical value that represents how much the price has moved relative to its starting point during that window.
- This "Impulse" value serves as the raw data source for all other calculations in the script.
2. The T3 Smoothing Algorithm Raw market data can be erratic and "noisy," making it difficult to see clear trends. To solve this, the script applies a sophisticated mathematical filter known as the T3.
- Unlike simple moving averages that can lag significantly behind price action, the T3 algorithm uses a multi-layered weighting system.
- It processes the Impulse data through several successive stages of smoothing to produce a curve that is highly responsive to recent changes while remaining fluid and free of jittery spikes.
3. Dynamic Range Channels To help traders understand the "boundaries" of current market volatility, the script identifies the highest and lowest impulse points over specific historical periods (the size of these periods adjusts automatically depending on whether you are viewing a 15-minute, 30-minute, or 60-minute chart).
- High/Low Boundaries: The script marks the absolute peak and trough reached within those timeframes.
- Center Channels: It also calculates the midpoint between these peaks and troughs, providing a visual "median" of the current momentum range.
User Interface and Visibility
The script includes a flexible display system that allows users to choose which data points are visible on their screen:
- Full View: Shows both the raw Impulse measurements and the smoothed T3 trend line.
- Impulse Only: Hides the smoothed line to focus strictly on the raw momentum spikes.
- Trend Only: Hides the raw impulses to provide a clean, smooth curve for identifying long-term direction.
Operational Constraints
To ensure accuracy, the logic is specifically optimized for medium-term timeframes (M15, M30, and M60). If used on other timeframes, the script will notify the user, as the "look-back" period required to calculate the range channels is calibrated specifically for those intervals.
//+------------------------------------------------------------------+
//| DayImpuls_T3_v2.mq4.mq4
//|
//| http://www.arkworldmarket.ru/forum/showthread.php?t=966&page=2&pp=10
//+------------------------------------------------------------------+
// Modest äîáàâèë ñãëàæèâàíèå ïî ìåòîäó t3. Äîáàâèë êàíàëû.
// Ñëåãêà èçìåíèë àëãîðèòì, ÷òîáû ïîíÿòíåå âîñïðèíèìàëñÿ êîä. Íà ñóòü îðèãèíàëà íå âëèÿåò ÍÈÊÀÊ.
// Óáèðàåì ëèøíþþ ãðàôèêó, ââîäèì óïðàâëåíèå ðåæèìîì îòîáðàæåíèÿ
// DisplayMode=0 Îòîáðàæàþòñÿ DayImpuls è ñëàæåííàÿ êðèâàÿ
// DisplayMode=1 Îòîáðàæàþòñÿ òîëüêî DayImpuls
// DisplayMode=2 Îòîáðàæàþòñÿ òîëüêî ñëàæåííàÿ êðèâàÿ
#property copyright ""
#property link      "http://www.arkworldmarket.ru/forum/showthread.php?t=966&page=2&pp=10"

#property indicator_separate_window
#property indicator_buffers 7
#property indicator_color1 Indigo
#property indicator_level1 0.0
//---- input parameters
extern int       per=14;
extern int       d=100;
extern int t3_period=8;
extern double b=0.7;
//extern  ChanPercent=70;
extern int DisplayMode=0;
//---- buffers
double  DayImp[];
double  t3[];
//double  MaxH[];
//double  MinH[];
double  MaxLine[];
double  MinLine[];
double  ChanLineMax[];
double  ChanLineMin[];
double Level[];
//+------------------------------------------------------------------+
//| Custom indicator initialization function                         |
//+------------------------------------------------------------------+
int init()
  {
//---- indicators
   if (DisplayMode>2 || DisplayMode<0)  DisplayMode=0;

   switch ( DisplayMode )
      {
      case 0:
         SetIndexStyle(0,DRAW_LINE,EMPTY,1,Magenta);
         SetIndexBuffer(0,DayImp);
         SetIndexStyle(1,DRAW_LINE,EMPTY,2,Red);
         SetIndexBuffer(1,t3);
         break;

      case 1:
         SetIndexStyle(0,DRAW_LINE,EMPTY,1,Magenta);
         SetIndexBuffer(0,DayImp);
         SetIndexStyle(1,DRAW_NONE,EMPTY,2,Red);
         SetIndexBuffer(1,t3);
         break;
      case 2:
         SetIndexStyle(0,DRAW_NONE);
         SetIndexBuffer(0,DayImp);
         SetIndexStyle(1,DRAW_LINE,EMPTY,2,Red);
         SetIndexBuffer(1,t3);
         break;


      default:
         SetIndexStyle(0,DRAW_LINE,EMPTY,1,Magenta);
         SetIndexBuffer(0,DayImp);
         SetIndexStyle(1,DRAW_LINE,EMPTY,2,Red);
         SetIndexBuffer(1,t3);
         break;
      }
   /*
   SetIndexStyle(0,DRAW_LINE);
   SetIndexBuffer(0,DayImp);
   SetIndexStyle(1,DRAW_LINE,EMPTY,2,Red);
   SetIndexBuffer(1,t3);
   */
   SetIndexStyle(2,DRAW_LINE,EMPTY,2,Goldenrod);
   SetIndexBuffer(2,MaxLine);
   SetIndexStyle(3,DRAW_LINE,EMPTY,2,Goldenrod);
   SetIndexBuffer(3,MinLine);
   SetIndexLabel(0,NULL); SetIndexLabel(1,NULL);SetIndexLabel(2,NULL);SetIndexLabel(3,NULL);
   SetIndexLabel(4,NULL);SetIndexLabel(5,NULL);

   SetIndexStyle(4,DRAW_LINE,EMPTY,2,DarkGreen);
   SetIndexBuffer(4,ChanLineMax);
   SetIndexStyle(5,DRAW_LINE,EMPTY,2,DarkGreen);
   SetIndexBuffer(5,ChanLineMin);
   SetIndexStyle(6,DRAW_LINE,EMPTY,1,Blue);
   SetIndexBuffer(6,Level);

//----
   return(0);
  }
//+------------------------------------------------------------------+
//| Custor indicator deinitialization function                       |
//+------------------------------------------------------------------+
int deinit()
  {
//----

//----
   return(0);
  }
//+------------------------------------------------------------------+
//| Custom indicator iteration function                              |
//+------------------------------------------------------------------+
int start()
  {
   int    counted_bars=IndicatorCounted();


int  shift,i,N;
double imp,mBar,Max,Min;
double e1,e2,e3,e4,e5,e6,c1,c2,c3,c4,n,w1,w2, b2,b3,dpo,Prise,k;
//SetLoopCount(0);
// loop from first bar to current bar (with shift=0)


//===========================================  Ýòî ÿ óæå íàêîëáàñèë t3: ===============
//=========================================== Âçÿò òèïîâîé êîä          ===============
   if(Bars<=t3_period) return(0);
//---- initial zero
   if(counted_bars<t3_period)
   {
     // for(i=1;i<=t3_period;i++) prise[Bars-i]=0.0;
      for(i=1;i<=t3_period;i++) t3[Bars-i]=0.0;
   }
//----
b2=b*b;
b3=b2*b;
c1=-b3;
c2=(3*(b2+b3));
c3=-3*(2*b2+b+b3);
c4=(1+3*b+b3+3*b2);
n=t3_period;

if (n<1) n=1;
n = 1 + 0.5*(n-1);
w1 = 2 / (n + 1);
w2 = 1 - w1;
//----
//================= Êîíåö   ====================  Ýòî ÿ óæå íàêîëáàñèë t3: ===============

int limit;
    counted_bars=IndicatorCounted();
//---- check for possible errors
   if(counted_bars<0) return(-1);
//---- last counted bar will be recounted
   if(counted_bars>0) counted_bars--;
   limit=Bars-counted_bars;
//---- main loop


for(shift=0; shift<limit; shift++)
//for shift=Bars-1 Downto 0

{
DayImp[shift]=1;
t3[shift]=0;

//SetIndexValue(shift,0);
//SetIndexValue2(shift,0);
}

mBar=d*per;

//for shift=mBar downto per
for( shift=Bars-96-1; shift>=0; shift--)
{
   imp=0;
   Level[shift]=0.0;
   for( i=shift ;i<=shift+per; i++)
   {
      imp=imp+(Open[i]-Close[i]);
   }

   imp=MathRound(imp/Point);

   if (imp==0 )imp=0.0001;
   if (imp!=0 )
      {
         imp=-imp;
         DayImp[shift]=imp;
      }

   //for( i=shift ;i<=shift+per; i++)

     // DayImp[shift]=iMA(NULL,0,14,0,MODE_SMMA,PRICE_HIGH,i);

  // ==================================== Ýòî ÿ óæå íàêîëáàñèë t3: ========================
  dpo=DayImp[shift];

  e1 = w1*dpo + w2*e1;
  e2 = w1*e1 + w2*e2;
  e3 = w1*e2 + w2*e3;
  e4 = w1*e3 + w2*e4;
  e5 = w1*e4 + w2*e5;
  e6 = w1*e5 + w2*e6;

  t3[shift] = c1*e6 + c2*e5 + c3*e4 + c4*e3;
  // ==========^^^====================== Ýòî ÿ óæå íàêîëáàñèë t3: ====^^^================
      switch ( Period() )
      {
      case 5: N=288; break;
      case 15: N=96; break;
      case 30: N=48; break;
      case 60: N=24; break;
      default: N=0; break;
      }

      if (N==0) {Alert("Work only in M15,M30,M60 timeframes");return(0);}
      Max=DayImp[shift+N-1];
      Min=DayImp[shift+N-1];

      for( i=shift ;i<=shift+N-1; i++)
      {
         if (Max<DayImp[i]) Max=DayImp[i];
         if (Min>DayImp[i]) Min=DayImp[i];
      }
      //MaxH[shift]=Max;//+(Max-Min)*(1-kChannel);
      //MinH[shift]=Min;//+(Max-Min)*(kChannel);
      MaxLine[shift]=Max;//+(Max-Min)*(1-kChannel);
      MinLine[shift]=Min;//+(Max-Min)*(kChannel);

      //k=((100-ChanPercent)/2)/100;
      ChanLineMax[shift]=Max/2; // Min+(Max-Min)*(1-k);
      ChanLineMin[shift]=Min/2; //Min+(Max-Min)*(k);
}

//----

//----
   return(0);
  }
//+------------------------------------------------------------------+
Comments