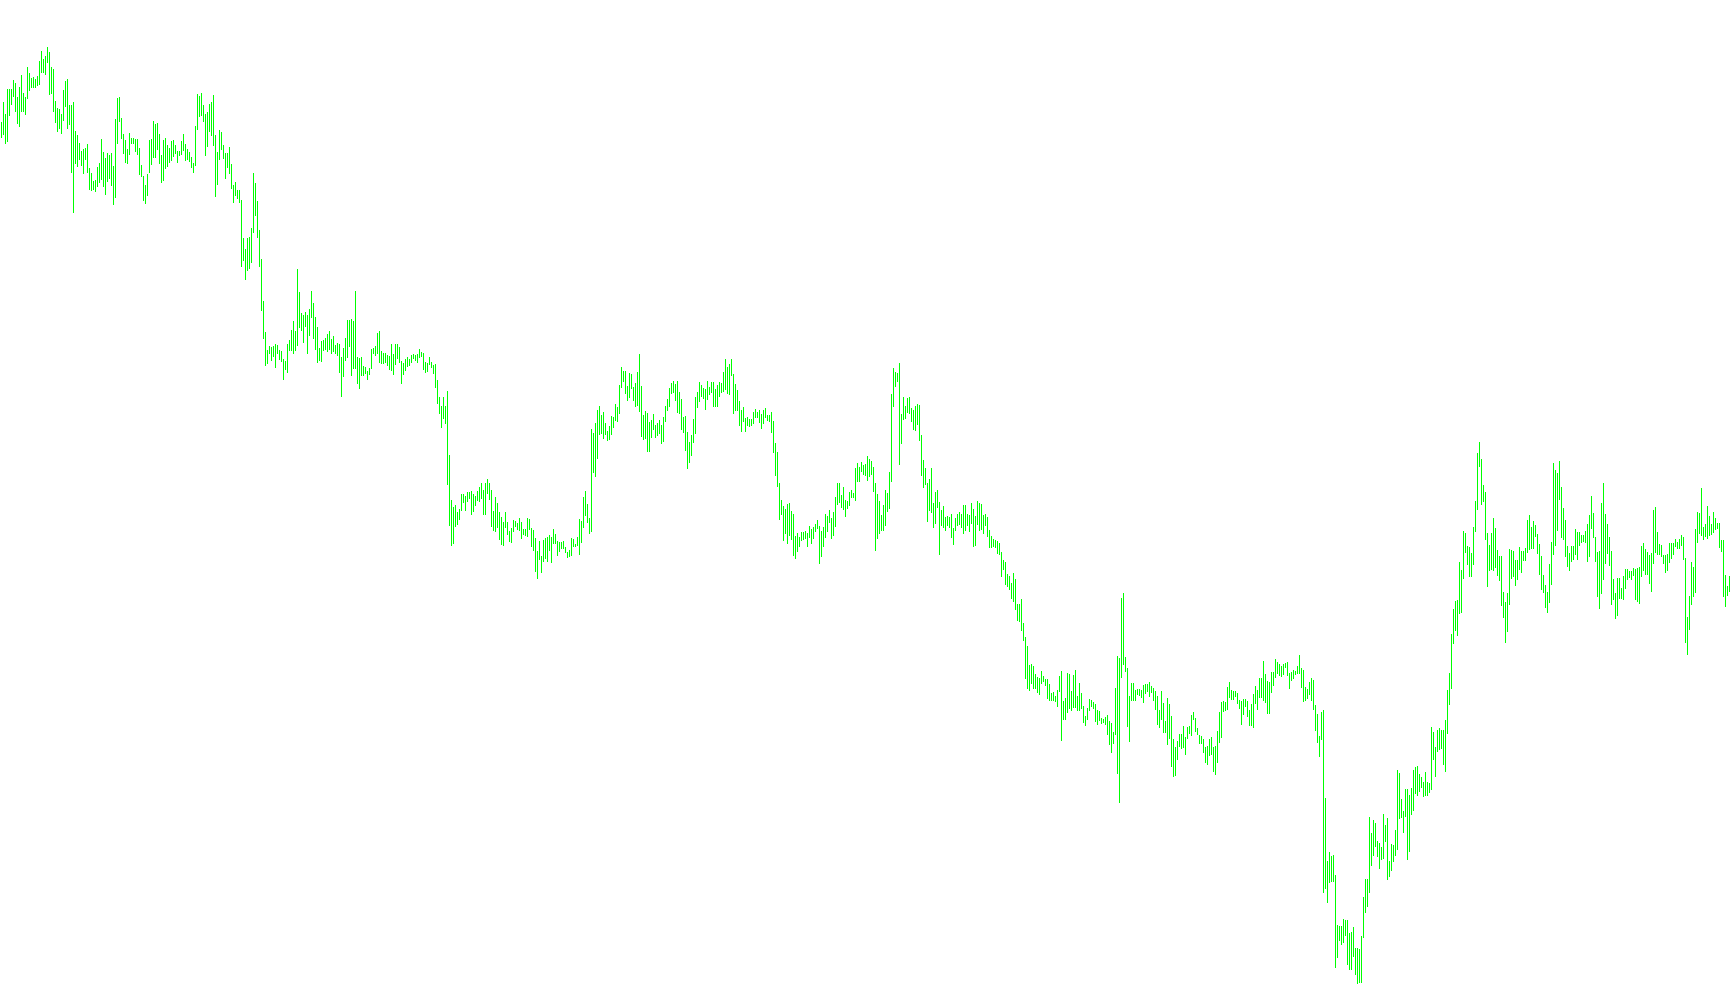
This tool is designed to help traders visualize price momentum by calculating the "imbalance" between opening and closing prices over specific time frames. Instead of looking at simple price movements, it identifies the cumulative pressure exerted during a series of candles to highlight underlying trends.
How the Logic Works
1. Data Collection Window The script looks back at a specific number of previous candles (defined by your settings). It focuses on the relationship between the "Open" and "Close" of every single candle within that window. By comparing these two points, the tool determines whether the price finished higher or lower than where it started for each individual period.
2. Calculating the Impulse The core logic involves summing up all those differences to create an "Impulse" value. If prices consistently closed higher than they opened, it represents upward pressure; if they closed lower, it represents downward pressure. The script aggregates these movements to provide a clearer picture of the market's direction rather than just looking at isolated price spikes.
3. Normalization and Smoothing To ensure the data is readable on your chart, the script performs a few refinements:
- Scaling: It converts the raw price differences into a standardized format so the visual representation remains consistent regardless of how volatile the currency pair is.
- Zero-Point Handling: If there is no measurable movement (a neutral state), the tool ensures the data remains stable rather than creating "breaks" in the line.
- Inversion: The logic applies a specific mathematical flip to the impulse value. This ensures that the visual signal on your screen aligns correctly with the direction of the market trend you are trying to track.
4. Visual Output The final result is plotted as a continuous line in a separate window at the bottom of your trading platform. This allows you to observe the "momentum" of the market independently from the price candles, making it easier to identify periods of significant strength or exhaustion.
/*
 * Filename:    DayImpulse.mq4
   forex-tsd.com
 */

#property indicator_separate_window
#property indicator_buffers 1
#property indicator_color1  Magenta

extern int per    = 14;  // Period for signal
extern int d = 100;

// Buffers for signals
double drawBuffer[];

int init() {
   string title = "DayImplus(" + per + ")";

   SetIndexStyle(0, DRAW_LINE, 0, 2);
   SetIndexBuffer(0, drawBuffer);

   // Shift everything forward
   //SetIndexShift(0, per);

   // Titles for each line
   SetIndexLabel(0, "DayImpuls(" + per + ")");

   IndicatorShortName(title);
   return(0);
}

int start() {
   int    shift, i, mBar;
   double imp;

      mBar=d*per;
      for(shift = mBar; shift >= per; shift--) {
         imp = 0;
         for (i=shift; i>=shift-per; i--) {
            imp=imp+(Open[i]-Close[i]);
         }
         imp=MathRound(imp/Point);
         if (imp==0) imp=0.0001;
         if (imp!=0) {
            imp = -imp;
            drawBuffer[shift-per] = imp;
         }
      }

   return(0);
}
Comments