DEMA_RLH_v2
Download script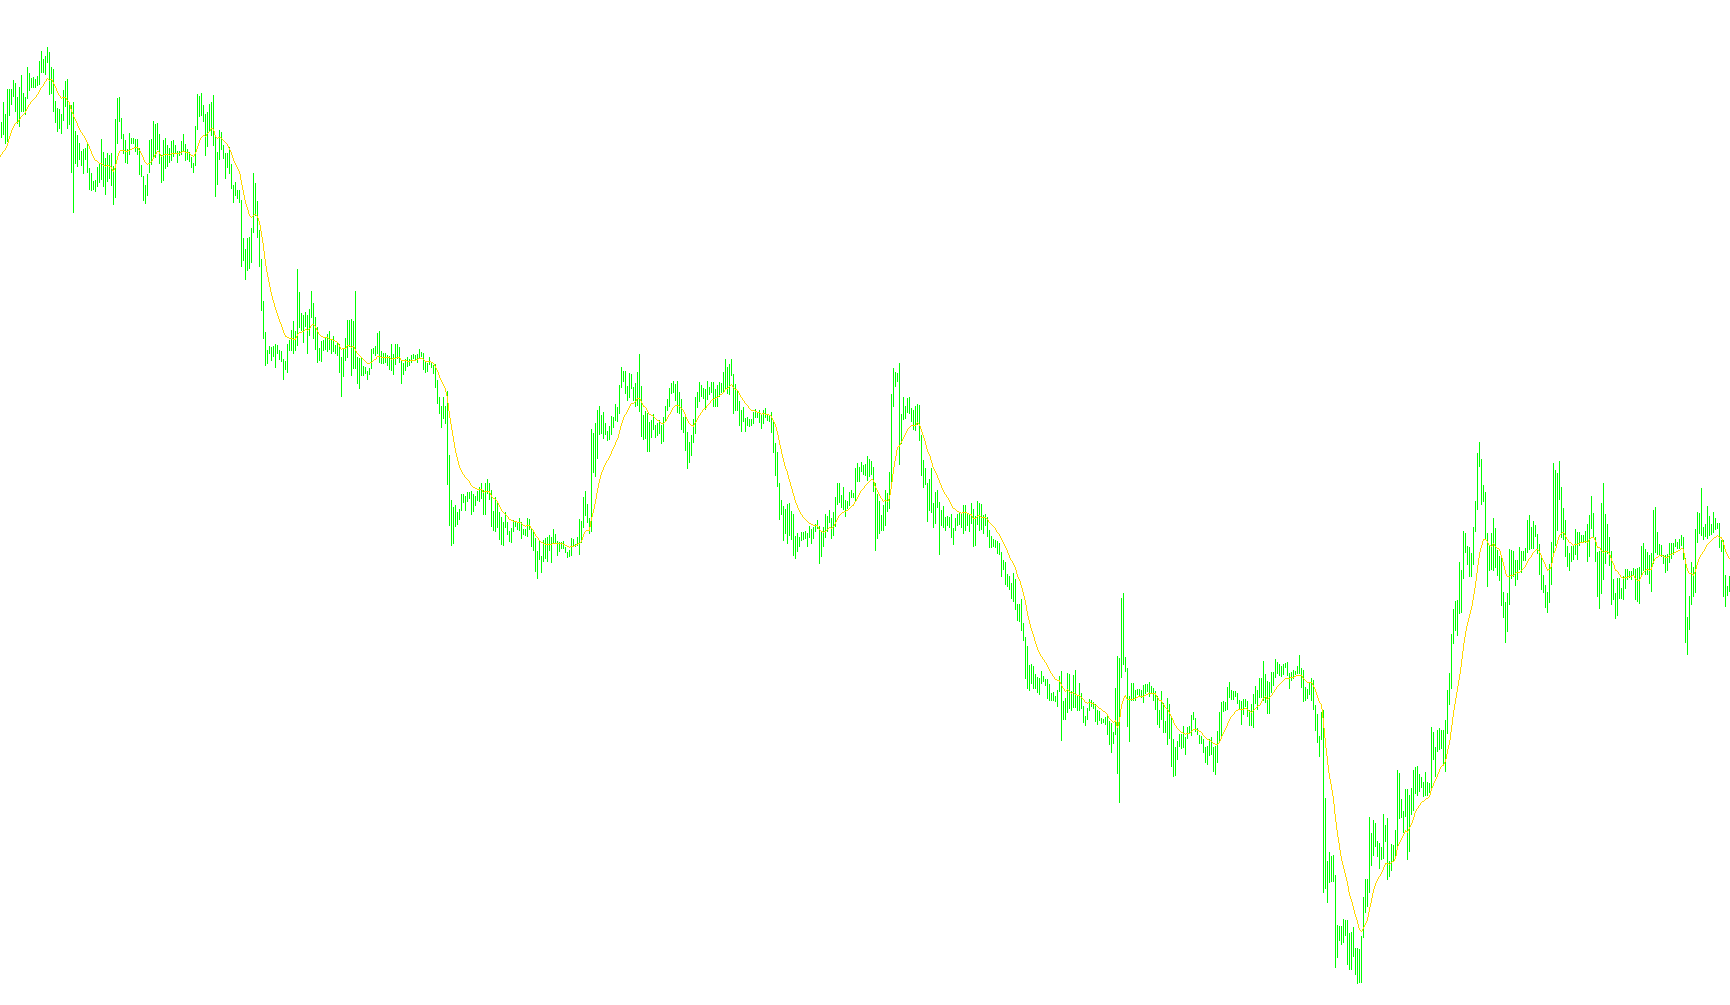
Overview of the DEMA_RLH Indicator
The DEMA_RLH is a specialized technical analysis tool designed to provide a highly responsive view of market trends. While standard moving averages are often criticized for "lagging"—meaning they react to price changes only after the move has already occurred—this script uses a sophisticated mathematical approach to reduce that delay, making it easier for traders to identify current momentum more quickly.
How the Logic Works
The indicator functions by layering three distinct types of calculations to arrive at its final result. It builds these layers as follows:
1. The Foundation (The Red Line) First, the script calculates a standard Exponential Moving Average (EMA). Unlike a simple average, an EMA places more importance on recent price data, allowing it to follow the current trend more closely than traditional methods.
2. The Secondary Layer (The Green Line) Next, the script takes that first EMA and performs another moving average calculation on it. By "averaging the average," the tool creates a smoother, secondary data point that represents the broader underlying movement of the trend.
3. The Final Result (The Yellow Line) The core logic of this script lies in its final formula. It combines the first two layers using a specific mathematical sequence: it doubles the value of the first EMA and then subtracts the second "EMA of the EMA" from it.
Why This Matters for Trading
By following this specific formula, the resulting Yellow Line (DEMA) achieves two goals simultaneously:
- Reduced Lag: It eliminates much of the delay found in standard moving averages, allowing the line to hug the price action more tightly.
- Trend Smoothing: Despite being faster than a regular EMA, it remains smooth enough to filter out minor "market noise," helping traders stay on the right side of the primary trend without getting distracted by insignificant fluctuations.
In summary, this tool is designed for users who need a faster, more reactive trend indicator that stays synchronized with live price movements while maintaining a clear, readable path.
//+------------------------------------------------------------------+
//|                                                   DEMA_RLH       |
//|                                    Copyright © 2006, Robert Hill |
//|                                       http://www.metaquotes.net/ |
//|                                                                  |
//| Based on the formula developed by Patrick Mulloy                 |
//|                                                                  |
//| It can be used in place of EMA or to smooth other indicators.    |
//|                                                                  |
//| DEMA = 2 * EMA - EMA of EMA                                      |
//|                                                                  |
//|  Red is EMA, Green is EMA of EMA, Yellow is DEMA                 |
//|                                                                  |
//+------------------------------------------------------------------+
#property  copyright "Copyright © 2006, Robert Hill "
#property  link      "http://www.metaquotes.net/"
//---- indicator settings
#property  indicator_chart_window
#property  indicator_buffers 3
#property  indicator_color1  Red
#property  indicator_color2  Green
#property  indicator_color3  Yellow
#property  indicator_width1  2
#property  indicator_width2  2
#property  indicator_width3  2
//----
extern int EMA_Period=14;
//---- buffers
double Dema[];
double Ema[];
double EmaOfEma[];
//+------------------------------------------------------------------+
//| Custom indicator initialization function                         |
//+------------------------------------------------------------------+
int init()
  {
//---- drawing settings
   SetIndexStyle(0,DRAW_LINE);
   SetIndexStyle(1,DRAW_LINE);
   SetIndexStyle(2,DRAW_LINE);
   SetIndexDrawBegin(0,EMA_Period);
   IndicatorDigits(MarketInfo(Symbol(),MODE_DIGITS)+2);
//---- 3 indicator buffers mapping
   if(!SetIndexBuffer(0,Ema) &&
      !SetIndexBuffer(1,EmaOfEma) &&
      !SetIndexBuffer(2,Dema))
      Print("cannot set indicator buffers!");
//---- name for DataWindow and indicator subwindow label
   IndicatorShortName("DEMA("+EMA_Period+")");
//---- initialization done
   return(0);
  }
//+------------------------------------------------------------------+
//|                                                                  |
//+------------------------------------------------------------------+
int start()
  {
   int i, limit;
   int    counted_bars=IndicatorCounted();
   if(counted_bars>0) counted_bars--;
//----
   limit=Bars-counted_bars;
//----
   for(i=limit; i>=0; i--)
      Ema[i]=iMA(NULL,0,EMA_Period,0,MODE_EMA,PRICE_CLOSE,i);
   for(i=limit; i >=0; i--)
      EmaOfEma[i]=iMAOnArray(Ema,Bars,EMA_Period,0,MODE_EMA,i);
   //========== COLOR CODING ===========================================
   for(i=limit; i >=0; i--)
      Dema[i]=2 * Ema[i] - EmaOfEma[i];
   return(0);
  }
//+------------------------------------------------------------------+
Comments