SMI_Helper
Download script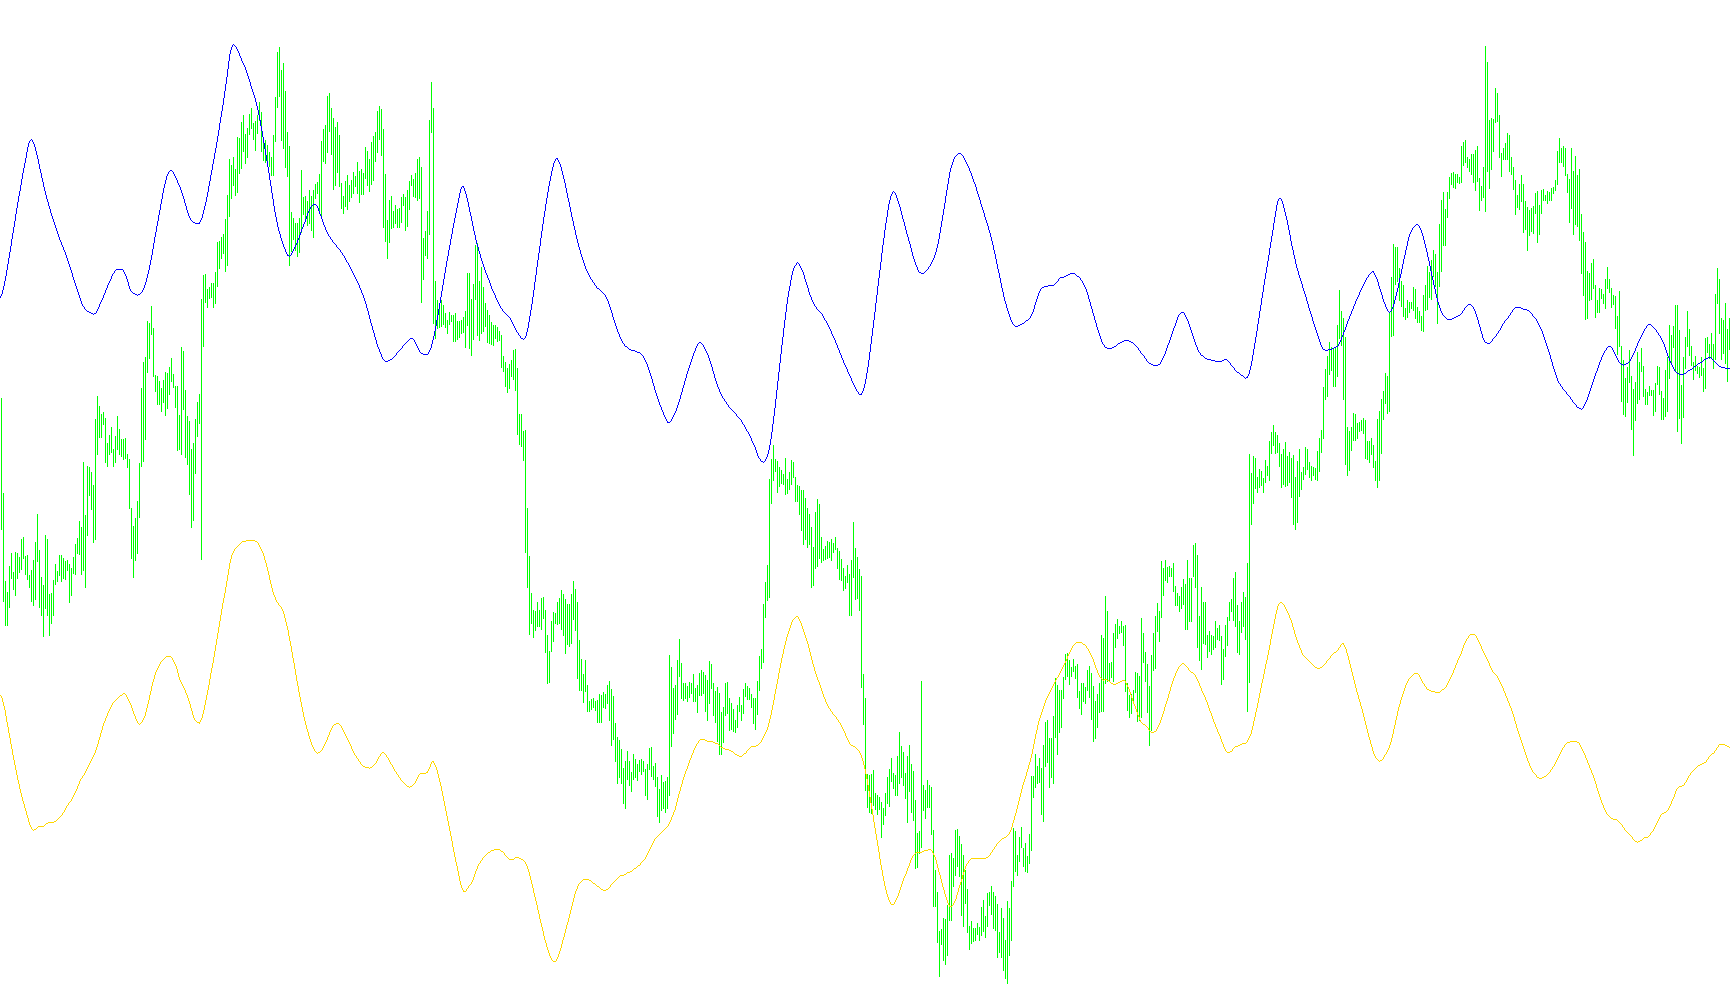
This tool is designed to provide traders with a visual representation of market momentum and price positioning relative to recent price action. Rather than just looking at the raw price, it focuses on how the current price compares to the volatility and "center point" of a specific timeframe.
How the Logic Works
The script processes market data through several layers of calculation to smooth out market noise and reveal underlying trends:
1. Establishing the Foundation (Price Range & Median) First, the script looks back at a specific number of recent candles (defined by your settings) to identify two key values:
- Price Range: It calculates the distance between the highest price reached and the lowest price reached during that period. This represents the "volatility" or the total trading space used.
- Median Price: It identifies the midpoint of that high and low range, creating a center point for that specific window of time.
2. Calculating Price Position The tool then determines where the current closing price sits in relation to that median. By subtracting the median from the current price, it creates a "Distance from Median" value. This tells the script whether the price is currently trading significantly above or below the middle of its recent range.
3. Multi-Layer Smoothing (The "Moving Average" Effect) Because raw price movements can be jumpy and erratic, the script applies several layers of mathematical smoothing to these calculations:
- Primary Smoothing: It takes the results from the first step and runs them through a moving average. This filters out minor fluctuations to show a clearer trend of where the price is leaning.
- Secondary Smoothing: It then applies a second, faster layer of smoothing to those results.
The Final Visual Output
The result of this multi-step process is a smoothed line that represents the "momentum" of the market. Instead of seeing every tiny zig-zag of price movement, the user sees a stabilized line that highlights:
- Trend Direction: Whether the momentum is moving upward or downward over time.
- Relative Strength: How aggressively the price is pulling away from its recent center point.
In simple terms, this script acts as a filter that strips away the "noise" of the market to show you the core trend of where price is moving in relation to its recent history.
//+------------------------------------------------------------------+
//|                                                   SMI_Helper.mq4 |
//|                      Copyright © 2005, MetaQuotes Software Corp. |
//|                                        http://www.metaquotes.net |
//+------------------------------------------------------------------+
#property copyright "Copyright © 2005, MetaQuotes Software Corp."
#property link      "http://www.metaquotes.net"

#property indicator_separate_window
#property indicator_buffers 2
#property indicator_color1 White
#property indicator_color2 Red
#property indicator_level1 0
//---- input parameters
extern int       Period_Q=15;
extern int       Period_R=50;
extern int       Period_S=5;
extern int       Signal=3;
extern int       method   =1;          // O MODE_SMA 1 MODE_EMA 2 MODE_SMMA 3 MODE_LWMA
//---- buffers
double SM_Buffer[];
double EMA_SM[];
double EMA2_SM[];
double EMA_HQ[];
double EMA2_HQ[];
double HQ_Buffer[];
//+------------------------------------------------------------------+
//| Custom indicator initialization function                         |
//+------------------------------------------------------------------+
int init()
  {
//---- indicators
   IndicatorBuffers(6);
   SetIndexStyle(0,DRAW_LINE);
   SetIndexBuffer(0,EMA2_SM);
   SetIndexStyle(1,DRAW_LINE);
   SetIndexBuffer(1,EMA2_HQ);
   SetIndexLabel(0,"SMI_Helper");
   SetIndexLabel(1,"Signal SMI_Helper");
   SetIndexBuffer(2,SM_Buffer);
   SetIndexBuffer(3,EMA_SM);
   SetIndexBuffer(4,EMA_HQ);
   SetIndexBuffer(5,HQ_Buffer);

   IndicatorShortName("SMI_Helper("+Period_Q+","+Period_R+","+Period_S+","+Signal+")");
//----
   return(0);
  }
//+------------------------------------------------------------------+
//| Custor indicator deinitialization function                       |
//+------------------------------------------------------------------+
int deinit()
  {
//---- TODO: add your code here

//----
   return(0);
  }
//+------------------------------------------------------------------+
//| Custom indicator iteration function                              |
//+------------------------------------------------------------------+
int start()
  {
   int    counted_bars=IndicatorCounted();
   int limit;
   int i;
//   double Median_Q[];
   if(counted_bars<0) return(-1);
   if(counted_bars>0) counted_bars--;
   limit=Bars-counted_bars;
//   ArrayResize(Median_Q,limit);
//   ArrayResize(HQ_Buffer,limit);
//   ArraySetAsSeries(Median_Q,true);
//   ArraySetAsSeries(HQ_Buffer,true);
   for (i=limit;i>=0;i--)
      {
      //Median_Q[i]=(High[Highest(NULL,0,MODE_HIGH,0,i)]+Low[Lowest(NULL,0,MODE_HIGH,0,i)])/2;
      HQ_Buffer[i]=High[Highest(NULL,0,MODE_HIGH,Period_Q,i)]-Low[Lowest(NULL,0,MODE_LOW,Period_Q,i)];
      SM_Buffer[i]=Close[i]-(High[Highest(NULL,0,MODE_HIGH,Period_Q,i)]+Low[Lowest(NULL,0,MODE_LOW,Period_Q,i)])/2;//Median_Q[i];
      }
//   for (i=limit;i>=0;i--)
//      {
//      SM_Buffer[i]=Close[i]-(High[Highest(NULL,0,MODE_HIGH,0,i)]+Low[Lowest(NULL,0,MODE_HIGH,0,i)])/2;//Median_Q[i];
//      }
   for (i=limit;i>=0;i--)
      {
      EMA_SM[i]=iMAOnArray(SM_Buffer,0,Period_R,0,method,i);
      EMA_HQ[i]=iMAOnArray(HQ_Buffer,0,Period_R,0,method,i);
      }
   for (i=limit;i>=0;i--)
      {
      EMA2_SM[i]=iMAOnArray(EMA_SM,0,Period_S,0,method,i);
      EMA2_HQ[i]=iMAOnArray(EMA_HQ,0,Period_S,0,method,i);
      }
/*
   for (i=limit-Period_R-Period_S-Signal;i>=0;i--)
      {
      SMI_Buffer[i]=100*EMA2_SM[i]/0.5/EMA2_HQ[i];
      }
   for (i=limit-Period_R-Period_S;i>=0;i--)
      {
      Signal_Buffer[i]=iMAOnArray(SMI_Buffer,0,Signal,0,MODE_EMA,i);
      }
*/

//---- TODO: add your code here

//----
   return(0);
  }
//+------------------------------------------------------------------+
Comments