Detrended_Price_Oscillator
Download script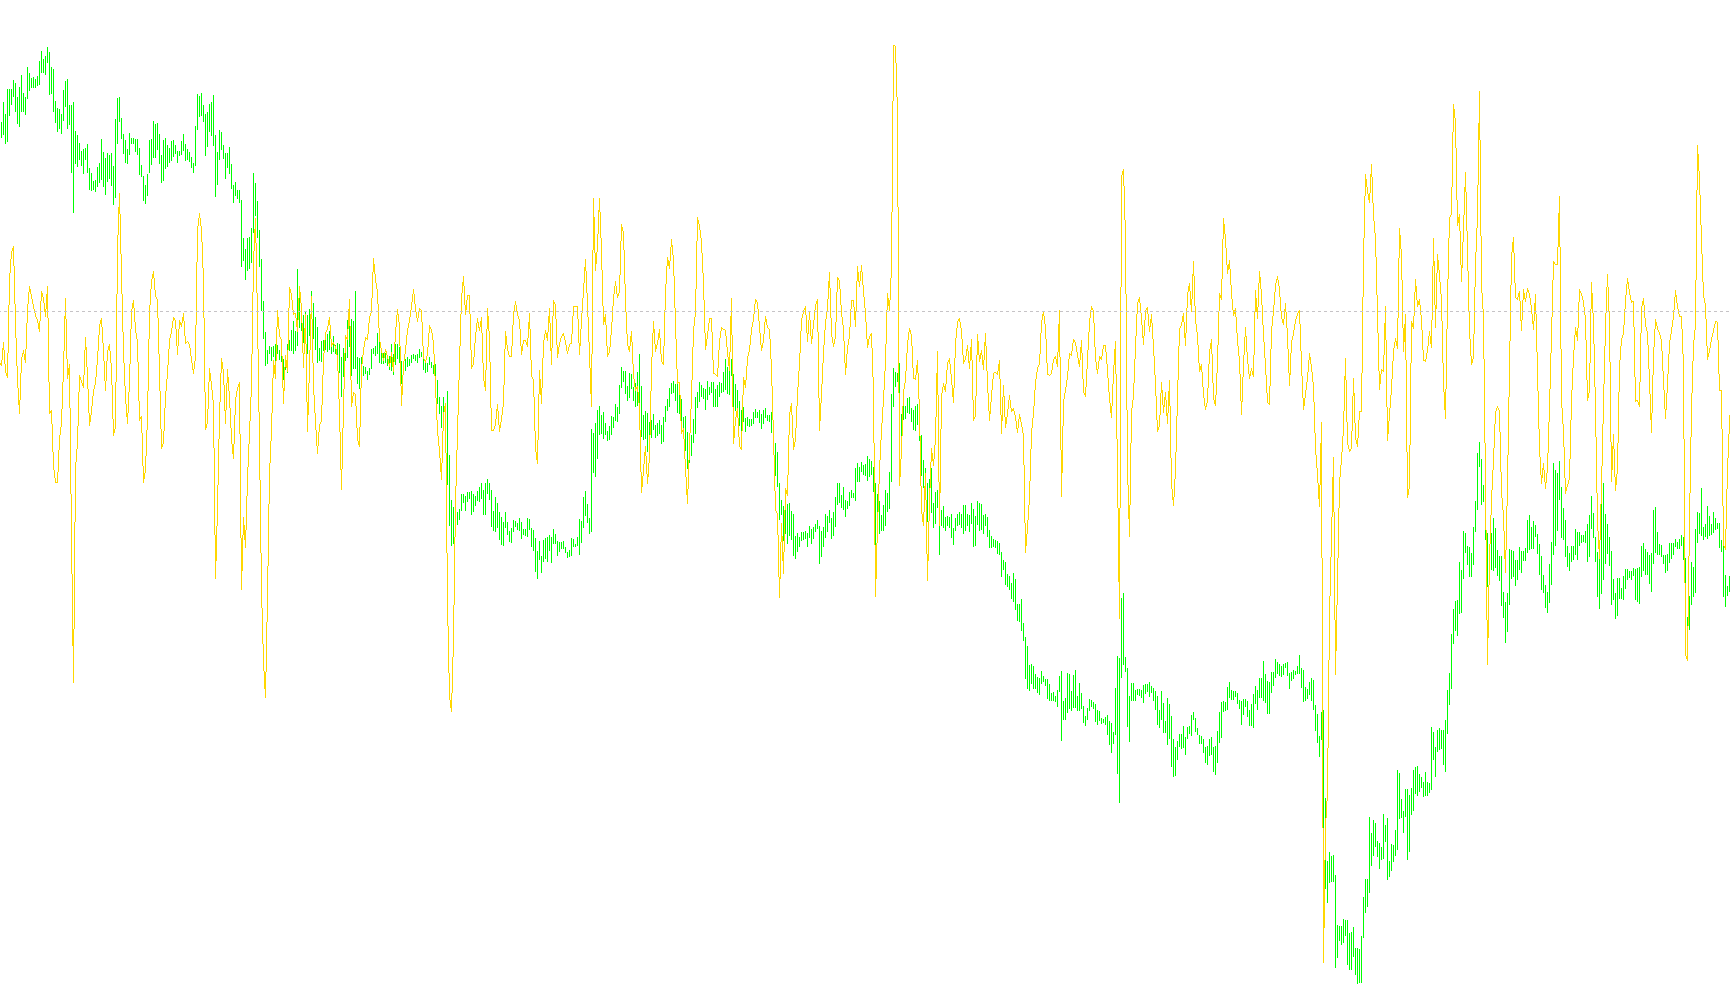
Technical Overview: Detrended Price Oscillator (DPO)
The Detrended Price Oscillator is a specialized technical analysis tool designed to help traders identify price momentum by removing long-term trends from the current market data. By "detrending" the price, the indicator allows you to see the underlying cycles and fluctuations that might otherwise be hidden by a steady upward or downward move.
Core Logic and Functionality
At its heart, the script works by calculating the difference between the current market price and a specific moving average. Here is how the logic flows:
- Price Selection: The user can choose which specific price point to track—whether it is the closing price, the opening price, the high, or the low of a candle.
- Trend Calculation (Moving Average): The script calculates a moving average based on a user-defined period. This represents the "trend" of the asset. You can choose between different calculation methods (such as Simple, Exponential, Smoothed, or Linear Weighted) to suit your specific trading style.
- The Detrending Process: The indicator subtracts the value of the moving average from the actual price. The resulting figure represents the "oscillation"—the degree to which the price is deviating from its recent average.
- When the result is positive, the price is trading above the trend.
- When the result is negative, the price is trading below the trend.
Dynamic Market Boundaries (Overbought and Oversold)
To provide a clearer picture of market extremes, the script includes an automated system to identify "overbought" and "oversold" conditions using Standard Deviation:
- Volatility Measurement: The tool analyzes the historical fluctuations of the oscillator itself to determine the current market volatility.
- Dynamic Thresholds: Instead of using static numbers, the script draws four horizontal reference lines that adjust automatically based on this volatility.
- The inner lines (marked as +/- 60%) act as a primary guide for moderate price extensions.
- The outer lines (marked as +/- 100%) serve as extreme alerts, signaling that the price may be significantly overextended in either direction.
Visual Summary
By isolating the price from its trend and plotting it against these dynamic boundaries, the indicator provides a visual representation of market "stretch." It helps traders identify when a move has become exhausted, potentially signaling an upcoming reversal or a period of consolidation.
//+------------------------------------------------------------------+
//|                                   Detrended Price Oscillator.mq4 |
//|                                       Copyright © 2008, Nievinny |
//|                                        http://www.viixtrader.com |
//+------------------------------------------------------------------+
#property copyright "Copyright © 2008, Nievinny"
#property link      "http://www.viixtrader.com"

#property indicator_separate_window
#property indicator_buffers 1
#property indicator_color1 Black

//---- input parameters
extern string    ____0____   = "Period of average";
extern int       DPOPeriod   = 7;
extern string    ____1____   = "Type of average: SMA - 0, EMA - 1, SMMA - 2, LWMA - 3";
extern int       MaType      = 0;
extern string    ____2____   = "Type of price: close - 0, open - 1, high - 2, low - 3";
extern int       PriceType   = 0;
extern string    ____3____   = "Moving Average Shift";
extern int       MaShift     = 0;
extern string    ____4____   = "Show oversold and overbought levels";
extern bool      ShowLevels  = true;
extern string    ____5____   = "Lines color (60%)";
extern color     LinesColor1 = Green;
extern string    ____6____   = "Lines color (100%)";
extern color     LinesColor2 = Green;
extern string    ____7____   = "Lines style: solid - 0, dashed - 1, dotted - 2";
extern int       LinesStyle  = 2;

//---- buffers
double ExtMapBuffer1[];

int init()
{
   SetIndexStyle(0,DRAW_LINE);
   SetIndexBuffer(0,ExtMapBuffer1);

   string Short="DPO("+DPOPeriod+", "+MaType+", "+PriceType+", "+MaShift+")";
   IndicatorShortName(Short);
   SetIndexLabel(0,Short);

   SetLevelValue(0, 0.0);

   SetIndexDrawBegin(0,DPOPeriod);
   return(0);
}

int deinit()
{
   // cleaning the mess
   if(ShowLevels == true)
   {
      ObjectDelete("dev1");
      ObjectDelete("dev2");

      ObjectDelete("dev3");
      ObjectDelete("dev4");
   }
   return(0);
}

int start()
{
   //main core
   int i, counted_bars=IndicatorCounted();

   if(Bars<=DPOPeriod) return(0);

   if(counted_bars<1)
      for(i=1;i<=DPOPeriod;i++) ExtMapBuffer1[Bars-i]=0.0;

   i=Bars-DPOPeriod-1;
   if(counted_bars>=DPOPeriod) i=Bars-counted_bars-1;
   while(i>=0)
   {
      ExtMapBuffer1[i] = priceSwitch(i) - iMA(NULL, NULL, DPOPeriod, MaShift, MaType, PriceType, i);
      i--;
   }

   // Showing oversold/overbought levels
   if(ShowLevels == true)
   {
      int window = WindowFind("DPO("+DPOPeriod+", "+MaType+", "+PriceType+", "+MaShift+")");
      if(window == -1)
      {
         window = 1;
      }
      // counting stddev
      ArraySetAsSeries(ExtMapBuffer1, true);
      double dev = iStdDevOnArray(ExtMapBuffer1, Bars-counted_bars-1, 100,0,0,0);
      // lines creation
      ObjectCreate("dev1", OBJ_HLINE, window, TimeCurrent(), 1.2*dev);
      ObjectSetText("dev1", "+60%");
      ObjectSet("dev1", OBJPROP_COLOR, LinesColor1);
      ObjectSet("dev1", OBJPROP_STYLE, LinesStyle);

      ObjectCreate("dev2", OBJ_HLINE, window, TimeCurrent(), -1.8*dev);
      ObjectSetText("dev2", "-60%");
      ObjectSet("dev2", OBJPROP_COLOR, LinesColor1);
      ObjectSet("dev2", OBJPROP_STYLE, LinesStyle);

      ObjectCreate("dev3", OBJ_HLINE, window, TimeCurrent(), 2*dev);
      ObjectSetText("dev3", "+100%");
      ObjectSet("dev3", OBJPROP_COLOR, LinesColor2);
      ObjectSet("dev3", OBJPROP_STYLE, LinesStyle);

      ObjectCreate("dev4", OBJ_HLINE, window, TimeCurrent(), -3*dev);
      ObjectSetText("dev4", "-100%");
      ObjectSet("dev4", OBJPROP_COLOR, LinesColor2);
      ObjectSet("dev4", OBJPROP_STYLE, LinesStyle);
   }
   return(0);
}

double priceSwitch(int i)
{
   double price;
   switch(PriceType)
   {
      case PRICE_CLOSE:
         price = Close[i];
      case PRICE_OPEN:
         price = Open[i];
      case PRICE_HIGH:
         price = High[i];
      case PRICE_LOW:
         price = Low[i];
   }
   return(price);
}
Comments