Discipline
Download script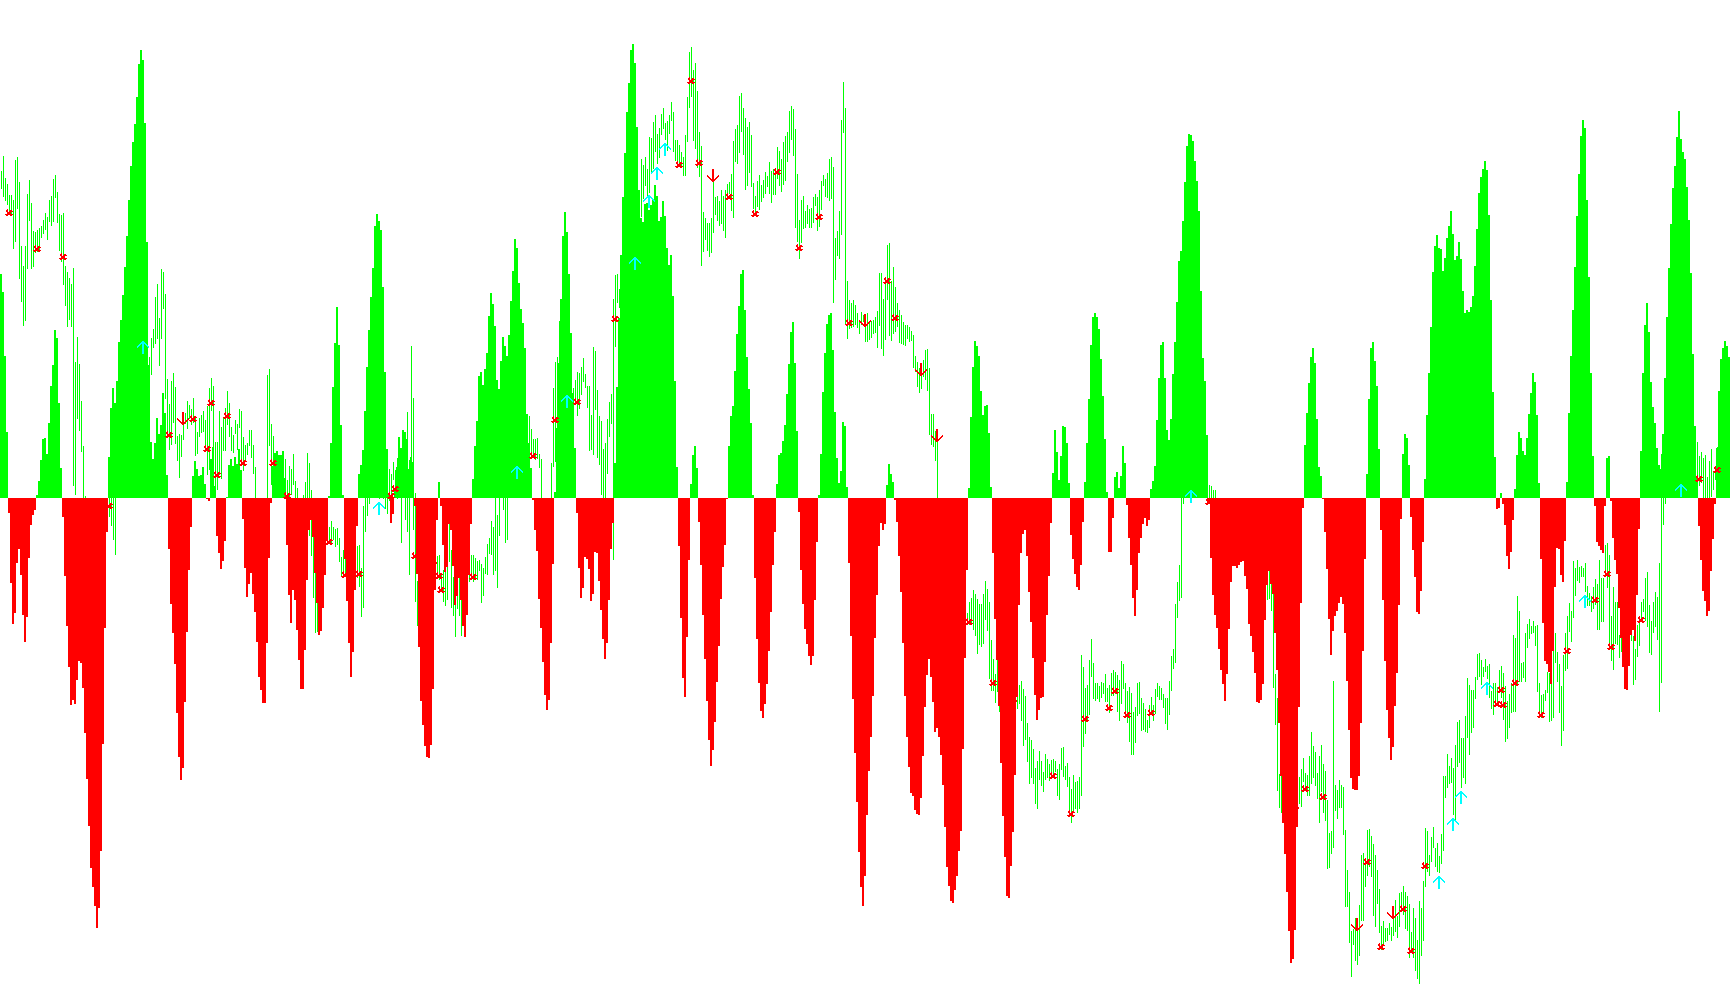
This script functions as a visual momentum and trend indicator designed to help traders identify potential entry points and structural shifts in the market. Rather than simply following price, it analyzes the relationship between current price action and historical volatility over a specific timeframe.
Core Logic and Data Processing
The tool begins by scanning a designated lookback period (set by the user) to determine the highest highs and lowest lows. It then calculates a "reference price" based on the user's preference—ranging from standard values like the opening/closing prices to more complex averages of the candle's range.
From there, it performs a mathematical transformation to gauge where the current price sits relative to that recent historical range. This result is smoothed using an exponential weighting system, which helps filter out "market noise" and ensures that the indicator doesn't react too aggressively to minor, insignificant price fluctuations.
The Momentum Calculation
The script converts this smoothed data into a specialized momentum value (referred to internally as "Fish"). This calculation is designed to highlight:
- Trend Strength: How much force is behind the current movement.
- Trend Reversals: Sudden changes in the direction of that force.
Visual Signals and On-Chart Markers
The tool translates these mathematical values into three distinct visual components on your chart:
- Dynamic Histograms: The indicator displays a dual-colored histogram in a separate window. This provides a real-time visual representation of momentum, shifting colors to indicate whether the prevailing trend is currently leaning bullish or bearish.
- Entry Signals: When the momentum exceeds a specific intensity threshold (determined by the script's "Threshold" logic) and confirms a shift in direction, the tool places automated markers directly on your chart:
- Aqua Arrows: These appear below the price to suggest potential buying opportunities when bullish momentum is strengthening.
- Red Arrows: These appear above the price to suggest potential selling opportunities when bearish momentum is gaining strength.
- Exit Alerts: The script also monitors for "crossovers"—moments where momentum flips from positive to negative (or vice versa). When these occur, it generates specific red markers to alert the trader that the current trend may be losing steam and a position might need to be closed.
User Customization
The logic is highly adaptable, allowing you to adjust the "period" (how much history to look at), the "price type" (which part of the candle to prioritize), and a "Fast Mode" which limits the calculation to only the most recent 100 bars for quicker reactions to live market movements.
//+------------------------------------------------------------------+
//|                                                       Discipline |
//|                 Copyright © 1999-2008, MetaQuotes Software Corp. |
//|                                                         FX_FISH  |
//+------------------------------------------------------------------+
#property copyright "Copyright © 2005, Kiko Segui"
#property link      "webtecnic@terra.es"
//----
#property indicator_separate_window
#property indicator_buffers 2
#property indicator_color1 Lime
#property indicator_color2 Red
//----
double buffer1[];
double buffer2[];
//----
extern int period=10;
extern int price=0; // 0 or other = (H+L)/2
                    // 1 = Open
                    // 2 = Close
                    // 3 = High
                    // 4 = Low
                    // 5 = (H+L+C)/3
                    // 6 = (O+C+H+L)/4
                    // 7 = (O+C)/2
extern bool Mode_Fast=false;
extern bool Signals  =true;
//+------------------------------------------------------------------+
//|                                                                  |
//+------------------------------------------------------------------+
int init()
  {
   SetIndexStyle(0,DRAW_HISTOGRAM,STYLE_SOLID,2,Lime);
   SetIndexBuffer(0,buffer1);
   SetIndexStyle(1,DRAW_HISTOGRAM,STYLE_SOLID,2,Red);
   SetIndexBuffer(1,buffer2);
   return(0);
  }
//+------------------------------------------------------------------+
//|                                                                  |
//+------------------------------------------------------------------+
int deinit()
  {
   int i;
   double tmp;
//----
   for(i=0;i<Bars;i++)
     {
      ObjectDelete("Sel"+DoubleToStr(i,0));
      ObjectDelete("Buy"+DoubleToStr(i,0));
      ObjectDelete("Exit"+DoubleToStr(i,0));
     }
   return(0);
  }
double Value=0,Value1=0,Value2=0,Fish=0,Fish1=0,Fish2=0;
int buy=0,sell=0;
//+------------------------------------------------------------------+
//|                                                                  |
//+------------------------------------------------------------------+
int start()
  {
   int i;
   int barras;
   double _price;
   double tmp;
   double MinL=0;
   double MaxH=0;
   double Threshold=1.2;
//----
   barras=Bars;
   if(Mode_Fast) barras=100;
   i=barras-period-1;
   while(i>=0)
     {
      MaxH=High[Highest(NULL,0,MODE_HIGH,period,i)];
      MinL= Low[ Lowest(NULL,0,MODE_LOW, period,i)];
      switch(price)
        {
         case 0:  _price=(High[i]+Low[i])/2;                   break;
         case 1:  _price= Open[i];                             break;
         case 2:  _price= Close[i];                            break;
         case 3:  _price= High[i];                             break;
         case 4:  _price= Low[i];                              break;
         case 5:  _price=(High[i]+Low[i]+Close[i])/3;          break;
         case 6:  _price=(Open[i]+High[i]+Low[i]+Close[i])/4;  break;
         case 7:  _price=(Open[i]+Close[i])/2;                 break;
         default: _price=(High[i]+Low[i])/2;                   break;
        }
      Value=0.33*2*((_price-MinL)/(MaxH-MinL)-0.5) + 0.67*Value1;
      Value=MathMin(MathMax(Value,-0.999),0.999);
      Fish =0.5*MathLog((1+Value)/(1-Value))+0.5*Fish1;
      buffer1[i]=0;
      buffer2[i]=0;
//----
      if((Fish<0) && (Fish1>0))
        {
         if(Signals)
           {
            ObjectCreate("Exit"+DoubleToStr(i,0),OBJ_ARROW,0,Time[i],_price);
            ObjectSet("Exit"+DoubleToStr(i,0),OBJPROP_ARROWCODE,251);
            ObjectSet("Exit"+DoubleToStr(i,0),OBJPROP_COLOR,Red);
           }
         buy=0;
        }
      if((Fish>0) && (Fish1<0))
        {
         if(Signals)
           {
            ObjectCreate("Exit"+DoubleToStr(i,0),OBJ_ARROW,0,Time[i],_price);
            ObjectSet("Exit"+DoubleToStr(i,0),OBJPROP_ARROWCODE,251);
            ObjectSet("Exit"+DoubleToStr(i,0),OBJPROP_COLOR,Red);
           }
         sell=0;
        }
      if(Fish>=0)
      { buffer1[i]=Fish; }
      else
      { buffer2[i]=Fish; }
      tmp=i;
      if((Fish<-Threshold) && (Fish>Fish1) && (Fish1<=Fish2))
        {
         if (Signals)
           {
            ObjectCreate("Sel"+DoubleToStr(i,0),OBJ_ARROW,0,Time[i],High[i]+5*Point);
            ObjectSet("Sel"+DoubleToStr(i,0),OBJPROP_ARROWCODE,226);
            ObjectSet("Sel"+DoubleToStr(i,0),OBJPROP_COLOR,Red);
           }
         sell=1;
        }
      if((Fish>Threshold) && (Fish<Fish1) && (Fish1>=Fish2))
        {
         if (Signals)
           {
            ObjectCreate("Buy"+DoubleToStr(i,0),OBJ_ARROW,0,Time[i],Low[i]-5*Point);
            ObjectSet("Buy"+DoubleToStr(i,0),OBJPROP_ARROWCODE,225);
            ObjectSet("Buy"+DoubleToStr(i,0),OBJPROP_COLOR,Aqua);
           }
         buy=1;
        }
      Value1=Value;
      Fish2=Fish1;
      Fish1=Fish;
      i--;
     }
   return(0);
  }
//+------------------------------------------------------------------+
Comments