i-AMA-Optimum
Download script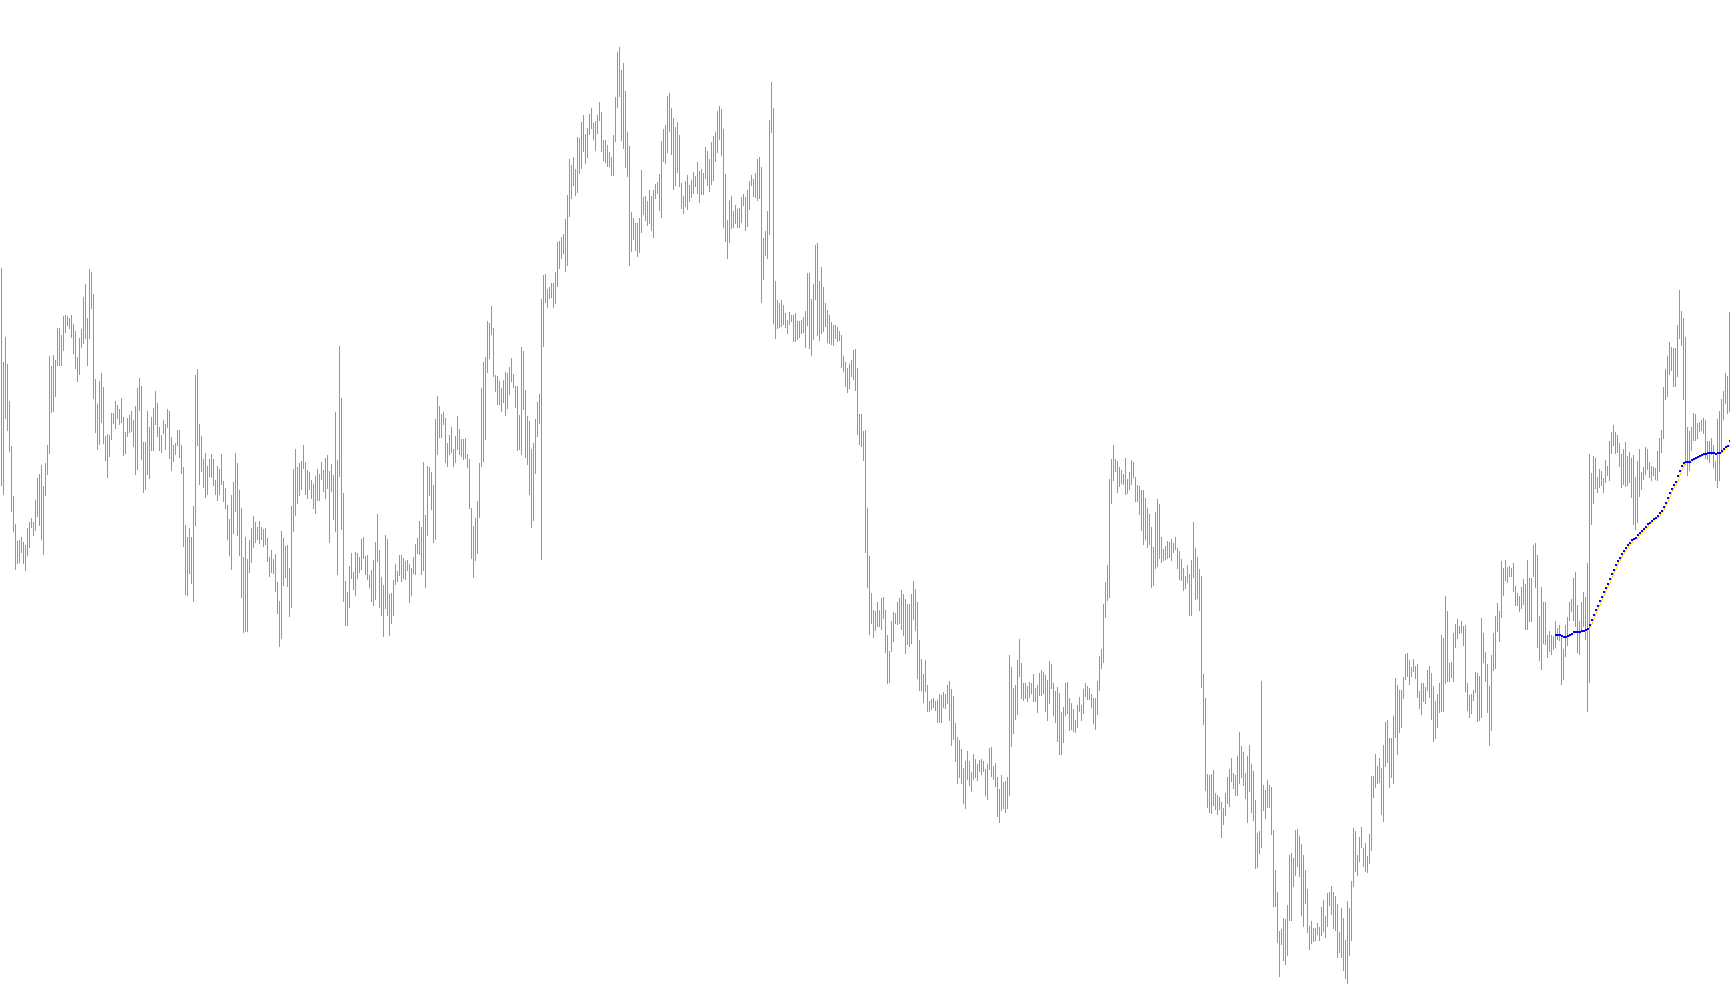
The AMA Optimum is a specialized technical analysis tool designed to help traders identify trends in financial markets by smoothing out price fluctuations. Unlike standard moving averages that can sometimes react too slowly or produce "noisy" signals, this script uses a dynamic calculation method to adapt to the current market conditions.
How it Works
The core logic of this indicator revolves around three main components: Signal Detection, Noise Filtering, and Adaptive Smoothing.
-
Signal vs. Noise Analysis: The tool constantly monitors the market to distinguish between actual price movement (the "Signal") and random, insignificant fluctuations (the "Noise"). It does this by comparing the current price difference against a specific look-back period. If the market is moving significantly over that period, it identifies it as a meaningful signal; if the movements are erratic and small, it classifies them as noise.
-
The Efficiency Ratio (ER): By calculating the relationship between the Signal and the Noise, the script generates an "Efficiency Ratio." This ratio tells the indicator how "efficient" the current trend is. A high efficiency suggests a strong, clear move in one direction, while a low efficiency suggests a choppy or sideways market.
-
Adaptive Smoothing: This is where the "Optimum" aspect comes in. The script uses the Efficiency Ratio to adjust its calculation speed in real-time.
- When the market is trending strongly (High Efficiency), the indicator becomes more responsive, allowing it to follow the price move closely.
- When the market is choppy or range-bound (Low Efficiency), the indicator automatically slows down, smoothing out the data to prevent "false starts" or erratic signals that could mislead a trader.
Visual Representation
On your trading chart, the script provides two primary visual elements:
- The AMA Line: A smooth line that tracks the smoothed price. This helps you visualize the underlying trend of the asset while filtering out minor market distractions.
- Signal Markers: The script also places specific markers (arrows) on the chart to highlight key points where the calculation identifies a significant shift, helping you pinpoint potential entry or exit areas based on the smoothed data.
Summary for Traders
Essentially, the AMA Optimum acts like an intelligent filter. It seeks to provide the "best of both worlds": it is fast enough to capture major price trends as they happen, but smart enough to stay stable during periods of low volatility. By balancing these two extremes automatically, it helps you see the "true" direction of the market more clearly.
//+--------------------------------------------------------------------------------------+
//                                                            A M A   O P T I M U M      |
//                                        Copyright © RickD  BJF Trading Group 2006      |
//                                                             http://fxstrategy.ca      |
//                                                                                       |
//Experts http://fxstrategy.ca/experts.php      SALE! 50% OFF                            |
//Indicators http://fxstrategy.ca/products.php  SALE!50% OFF                             |
//Digital Filters Strategy http://fxstrategy.ca/digital_filtrs.php  SALE!50% OFF         |
//Trading Signals http://fxstrategy.ca/signals.php Two weeks FREE! No CC.                |
// forex calendar, research, article ....                                                |
//+--------------------------------------------------------------------------------------+
#property copyright "© RickD  BJF Trading Group 2006"
#property link      "http://fxstrategy.ca/products.php"
//----
#define major   1
#define minor   0
//---- indicator settings
#property indicator_chart_window
#property indicator_buffers 2
#property indicator_color1  Orange
#property indicator_color2  Black
#property indicator_width1  2
//---- indicator parameters
extern int P = 1000;
extern double Fast = 2;
extern double Slow = 10;
//---- indicator buffers
double buf1[];
double buf2[];
//----
double SlowSC, FastSC;
double AMA;
double Noise, Signal;
double ER, SSC;
//+------------------------------------------------------------------+
//|                                                                  |
//+------------------------------------------------------------------+
int init()
  {
//---- âû÷èñëÿåì ñãëàæèâàþùèå êîíñòàíòû
   SlowSC = 2 / (1 + Slow);
   FastSC = 2 / (1 + Fast);
//----
   SetIndexStyle(0, DRAW_LINE, STYLE_SOLID, 1);
   SetIndexStyle(1, DRAW_ARROW);
   SetIndexArrow(1, 158);
// IndicatorDigits(MarketInfo(Symbol(), MODE_DIGITS) + 1);
   SetIndexBuffer(0, buf1);
   SetIndexBuffer(1, buf2);
//----
   SetIndexEmptyValue(0, 0.0);
   SetIndexEmptyValue(1, 0.0);
//----
   IndicatorShortName("AMA("+ P + ", " + Fast + ", " + Slow + ")");
   return (0);
  }
//+------------------------------------------------------------------+
//|                                                                  |
//+------------------------------------------------------------------+
int start()
  {
   if(Bars < P)
       return (0);
   int counted = IndicatorCounted();
//   if(Symbol() == "EURUSD")
//       Print("C= ", counted, " B= ", Bars);
   if(counted < 0)
       return (-1);
   if(counted == Bars-1)
       return (0);
   int limit = 0;
   if(counted == 0 || counted > Bars-2)
     {
       Noise = 0;
       limit = Bars - 2;
     }
//----
   for(int i = limit; i >= 0; i--)
     {
       if(limit > 0 && i > limit - P)
         {
           Noise += MathAbs(Open[i] - Open[i+1]);
           buf1[i] = 0;
           buf2[i] = 0;
           continue;
         }
       Signal = MathAbs(Open[i] - Open[i+P]);
       Noise += MathAbs(Open[i] - Open[i+1]);
       Noise -= MathAbs(Open[i+P] - Open[i+1+P]);
   	   //----
   	   ER = 1;
   	   if(Noise > 0)
   	       ER = Signal / Noise;
   	   SSC = MathPow(SlowSC + ER*(FastSC - SlowSC), 2);
   	   //----
       if(i == limit - P)
           AMA = Open[i];
       else
           AMA = SSC*Open[i] + (1 - SSC)*buf1[i+1];
       buf1[i] = AMA;
       buf2[i] = AMA;
     }
   return (0);
  }
//+------------------------------------------------------------------+
Comments