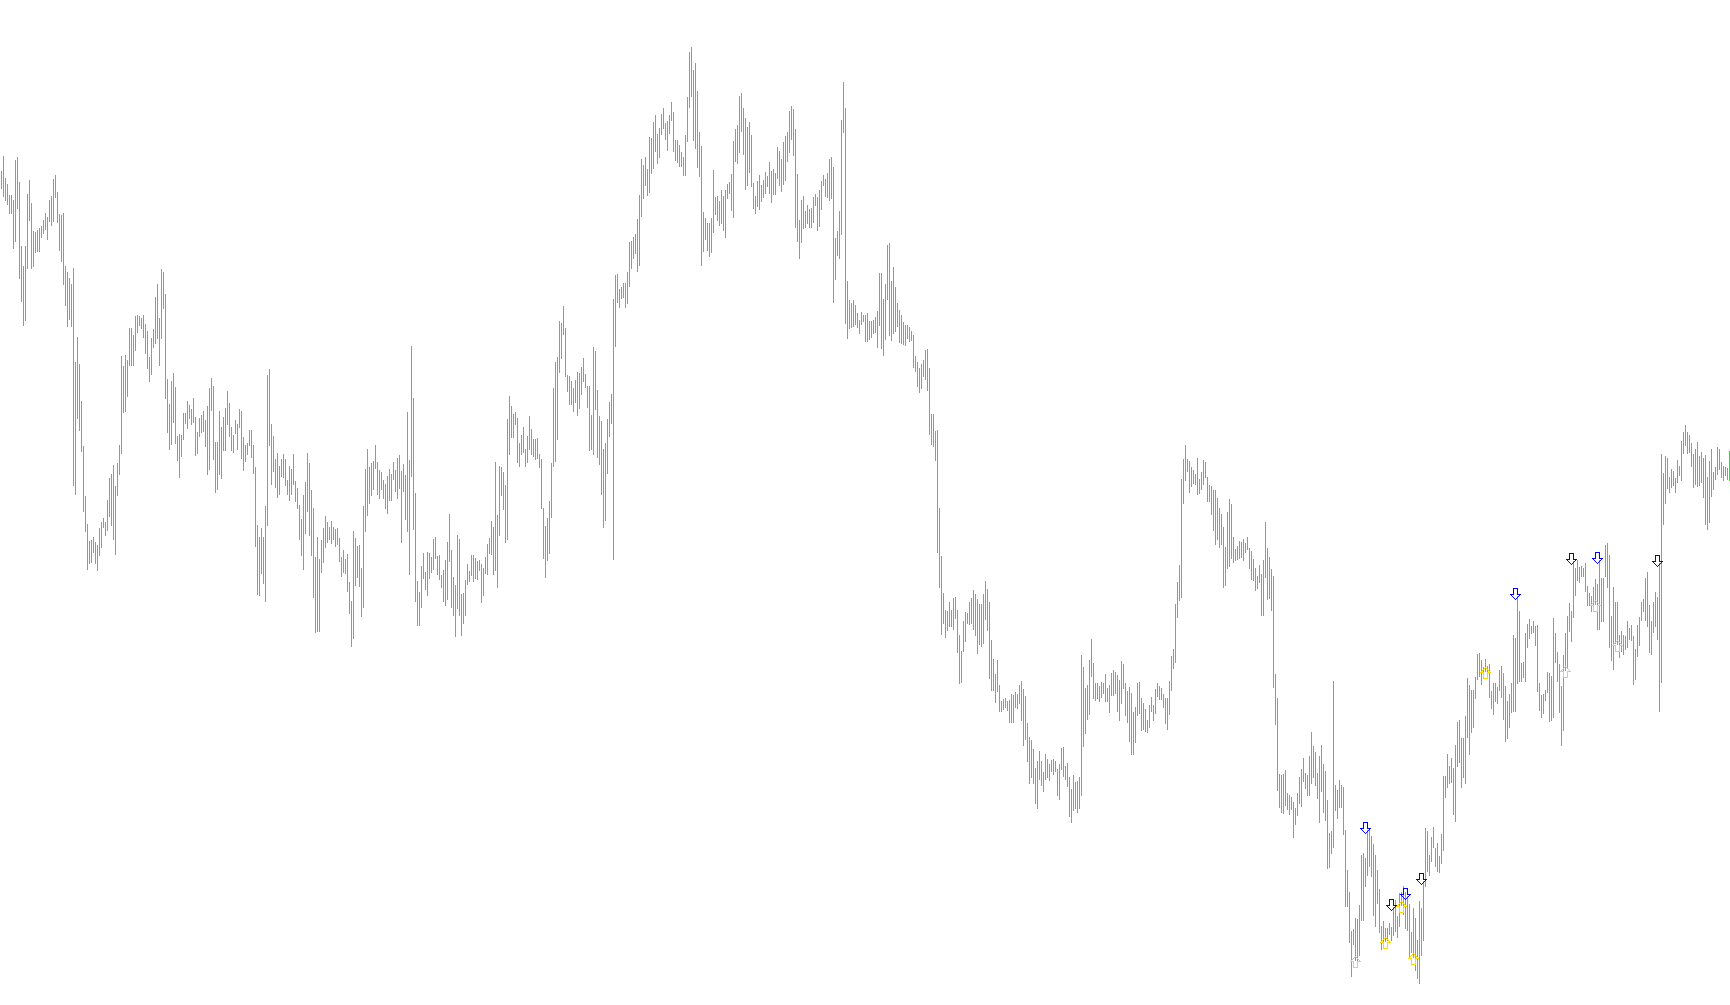
This tool is designed to act as a visual signal on your trading charts, specifically identifying potential shifts in market momentum. Rather than cluttering your screen with constant lines, it functions by identifying specific price patterns and placing distinct markers (arrows) at the exact moments where a trend transition occurs.
How the Logic Works
The script constantly monitors recent historical price data to detect two primary types of movements: upward momentum and downward momentum. It looks specifically at the relationship between the high and low prices of several consecutive candles to determine if the market is "turning."
Upward Signal Logic: The tool scans for a specific configuration where the current price action suggests a reversal toward the upside. It looks for a scenario where:
- The recent lows form a distinct "V" or "U" shape (where previous lows were higher than the current low).
- The closing prices follow a steady upward progression.
- A specific crossover occurs between the current price and the preceding candle's movements.
When these conditions align, the script places a blue arrow below the candle to signal a potential move upward.
Downward Signal Logic: Conversely, the tool monitors for a shift toward the downside. It looks for a mirrored configuration where:
- The recent highs form a downward peak (where previous highs were lower than the current high).
- The closing prices follow a steady downward progression.
- A specific downward crossover occurs between the price action of the current and previous candles.
When these conditions are met, the script places a red arrow above the candle to signal a potential move downward.
Key Features for the User
- Clean Visuals: The indicator does not draw a continuous line across your chart. Instead, it only appears when the mathematical logic identifies a trend change, helping you stay focused on significant price action rather than market "noise."
- Automatic Calculation: The script automatically handles all calculations based on the most recent 300 bars of data (customizable), ensuring that the signals remain relevant to current market conditions.
- Precision Placement: Signals are plotted at a slight offset from the candle's high or low points, ensuring they are clearly visible and do not overlap directly with the price bars.
In summary, this is a momentum-tracking tool that automates the detection of complex price patterns, providing you with visual "heads-up" signals whenever the market shifts its direction.
//+------------------------------------------------------------------+
//|                    DM.mq4                                     |
//|        AlexP    conversion only
//|               thanks Ramdass   and of course Finware.ru          |
//+------------------------------------------------------------------+
#property copyright "Copyright © 2005, MetaQuotes Software Corp."
#property link      "http://www.metaquotes.net"

#property indicator_chart_window
#property indicator_buffers 2
#property indicator_color1 Blue
#property indicator_color2 Red

extern int CountBars=300;
//---- buffers
double UPBuffer[];
double DownBuffer[];
//+------------------------------------------------------------------+
//| Custom indicator initialization function                         |
//+------------------------------------------------------------------+
int init()
  {
    string short_name;
//---- indicator line
   IndicatorBuffers(2);
   SetIndexStyle(0,DRAW_ARROW);
   SetIndexArrow(0,241);
   SetIndexBuffer(0,UPBuffer);
   SetIndexStyle(1,DRAW_ARROW);
   SetIndexArrow(1,242);
   SetIndexBuffer(1,DownBuffer);
//----
   return(0);
  }
//+------------------------------------------------------------------+
//| SATLs                                                            |
//+------------------------------------------------------------------+
int start()
  {
   SetIndexDrawBegin(0,Bars-CountBars+64);
   SetIndexDrawBegin(1,Bars-CountBars+64);
   int i,counted_bars=IndicatorCounted();
   double c2, c1, c0, c11, l2, l1, l0, l11, h2, h1, h0, h11,val1, val2, i1;
   bool trend,old;
//----
   if(Bars<=64) return(0);
//---- initial zero
   if(counted_bars<64)
   {
      for(i=1;i<=0;i++) UPBuffer[CountBars-i]=0.0;
      for(i=1;i<=0;i++) DownBuffer[CountBars-i]=0.0;
   }
//----
   i=CountBars-64-1;
// if(counted_bars>=64) i=Bars-counted_bars-1;
   while(i>=0)
    {

c2=iClose(Symbol(),NULL,i+4);
c1=iClose(Symbol(),NULL,i+3);
c0=iClose(Symbol(),NULL,i+2);
c11=iClose(Symbol(),NULL,i+1);
l2=iLow(Symbol(),NULL,i+4);
l1=iLow(Symbol(),NULL,i+3);
l0=iLow(Symbol(),NULL,i+2);
l11=iLow(Symbol(),NULL,i+1);
h2=iHigh(Symbol(),NULL,i+4);
h1=iHigh(Symbol(),NULL,i+3);
h0=iHigh(Symbol(),NULL,i+2);
h11=iHigh(Symbol(),NULL,i+1);

UPBuffer[i]=0.0; DownBuffer[i]=0.0;

if (l2>l0 && l1>l0 && l0<=l11 && c2>c1 && c1>c0 && c0<c11) trend=true; // óñëîâèå äëÿ áàé
if (h2<h0 && h1<h0 && h0>=h11 && c2<c1 && c1<c0 && c0>c11) trend=false;

if ((! trend==old) && trend==true) UPBuffer[i]=Low[i]-5*Point;
if ((! trend==old) && trend==false) DownBuffer[i]=High[i]+5*Point;
old=trend;

      i--;
     }
   return(0);
  }

//+------------------------------------------------------------------+
Comments