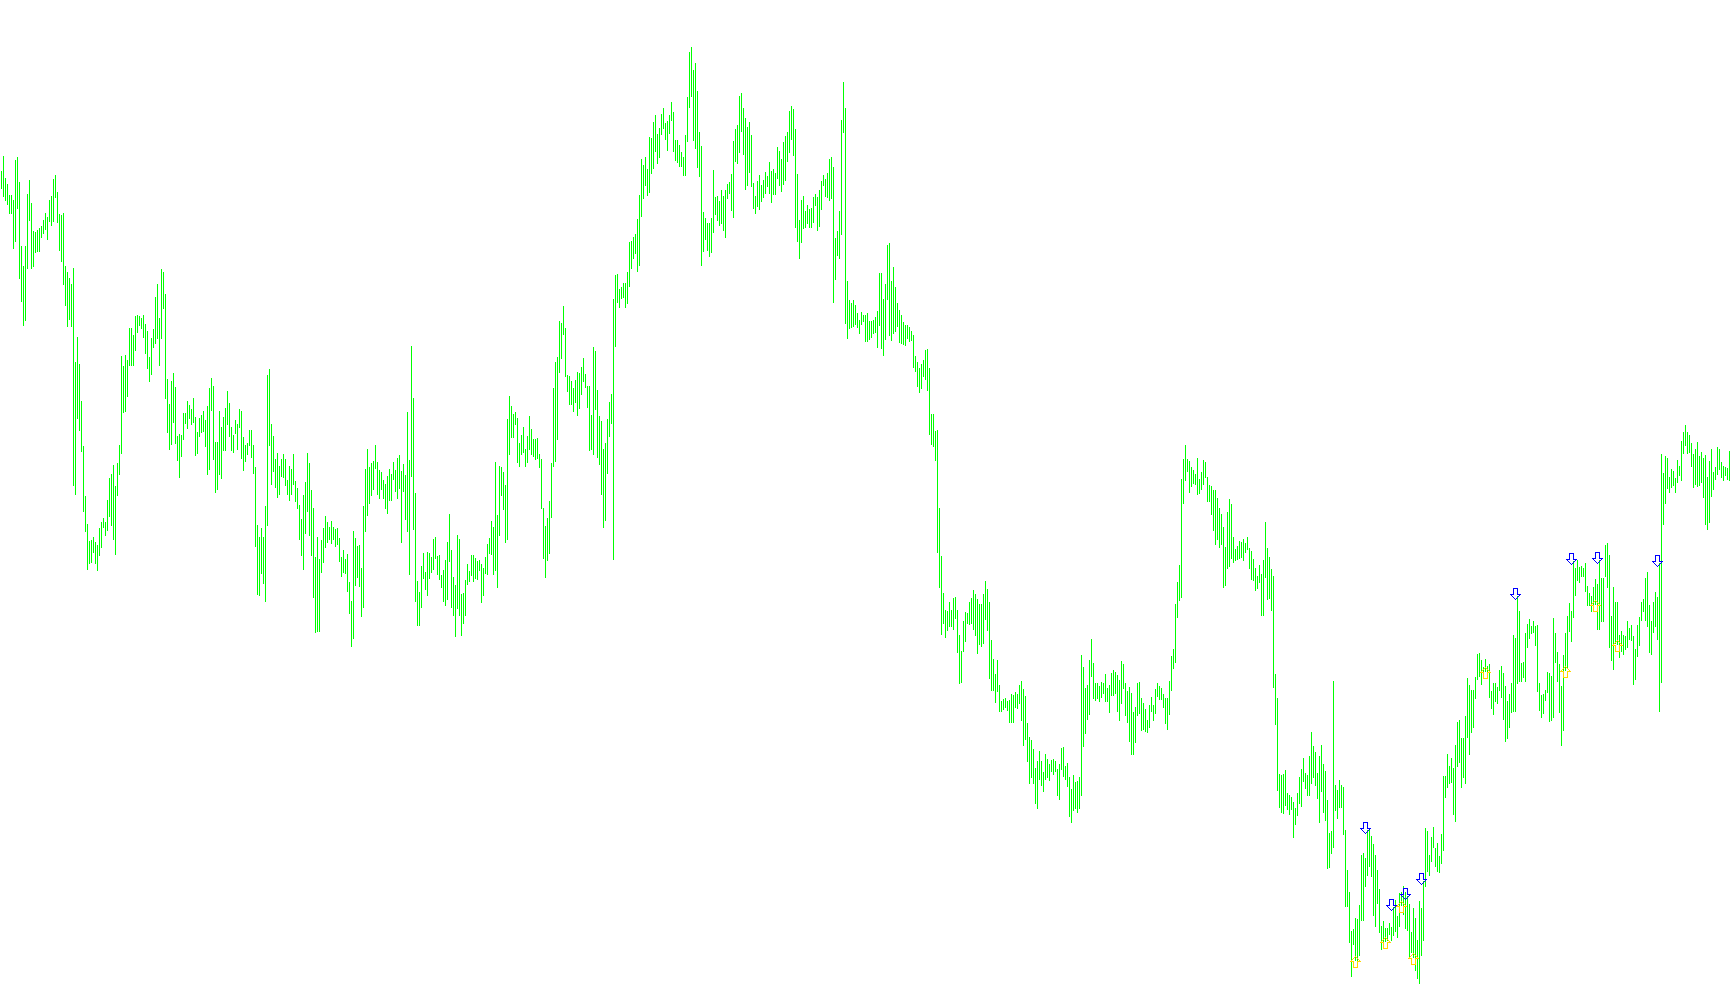
This indicator is designed to act as a visual signaling tool on your trading charts, specifically aimed at identifying shifts in market momentum. Instead of cluttering the screen with continuous lines, it focuses on pinpointing specific moments where the price structure suggests a potential change in direction.
How the Logic Works
The script scans the historical price data by looking at a specific sequence of price movements—specifically, it analyzes a group of candles to identify distinct "pivot" patterns. To determine if a signal should appear, it evaluates four key components of the market action:
- Price Lows and Highs: It looks for instances where the current low point is significantly lower than the lows of preceding candles, or where a high point stands out as significantly higher than its neighbors. This helps identify "bottoms" and "tops."
- Closing Price Progression: The tool tracks the relationship between consecutive closing prices. It checks if the price has been steadily moving in one direction before suddenly breaking that pattern.
- Trend Reversal Detection: The logic specifically seeks out "V-shaped" or "Inverted V-shaped" formations. For an upward signal, it looks for a sequence where the price hits a new low and then begins to recover with stronger closing prices. For a downward signal, it looks for the opposite: a sequence hitting a new high followed by a drop.
- Signal Filtering: To prevent the chart from being flooded with arrows on every minor price tick, the script includes a "state memory." It only places a visual marker at the exact moment the trend status flips from one direction to another.
Visual Output
Once the logic identifies these specific conditions, it marks the chart with distinct symbols:
- Blue Arrows: These appear below the price action when the script detects a shift toward an upward trend (a potential buying opportunity).
- Red Arrows: These appear above the price action when the script detects a shift toward a downward trend (a potential selling opportunity).
By analyzing these structural relationships, the indicator aims to highlight transitions in market sentiment, helping traders visualize where the "swing" in price might be occurring.
//+------------------------------------------------------------------+
//|        DM.mq4                                                    |
//|        AlexP conversion only                                     |
//|        thanks Ramdass   and of course Finware.ru                 |
//+------------------------------------------------------------------+
#property copyright "Copyright © 2005, MetaQuotes Software Corp."
#property link      "http://www.metaquotes.net"
//----
#property indicator_chart_window
#property indicator_buffers 2
#property indicator_color1 Blue
#property indicator_color2 Red
//----
extern int CountBars=300;
//---- buffers
double UPBuffer[];
double DownBuffer[];
//+------------------------------------------------------------------+
//| Custom indicator initialization function                         |
//+------------------------------------------------------------------+
int init()
  {
   string short_name;
//---- indicator line
   IndicatorBuffers(2);
   SetIndexStyle(0,DRAW_ARROW);
   SetIndexArrow(0,241);
   SetIndexBuffer(0,UPBuffer);
   SetIndexStyle(1,DRAW_ARROW);
   SetIndexArrow(1,242);
   SetIndexBuffer(1,DownBuffer);
//----
   return(0);
  }
//+------------------------------------------------------------------+
//| SATLs                                                            |
//+------------------------------------------------------------------+
int start()
  {
   SetIndexDrawBegin(0,Bars-CountBars+64);
   SetIndexDrawBegin(1,Bars-CountBars+64);
   int i,counted_bars=IndicatorCounted();
   double c2, c1, c0, c11, l2, l1, l0, l11, h2, h1, h0, h11,val1, val2, i1;
   bool trend,old;
//----
   if(Bars<=64) return(0);
//---- initial zero
   if(counted_bars<64)
     {
      for(i=1;i<=0;i++) UPBuffer[CountBars-i]=0.0;
      for(i=1;i<=0;i++) DownBuffer[CountBars-i]=0.0;
     }
//----
   i=CountBars-64-1;
   // if(counted_bars>=64) i=Bars-counted_bars-1;
   while(i>=0)
     {
      c2=iClose(Symbol(),NULL,i+4);
      c1=iClose(Symbol(),NULL,i+3);
      c0=iClose(Symbol(),NULL,i+2);
      c11=iClose(Symbol(),NULL,i+1);
      l2=iLow(Symbol(),NULL,i+4);
      l1=iLow(Symbol(),NULL,i+3);
      l0=iLow(Symbol(),NULL,i+2);
      l11=iLow(Symbol(),NULL,i+1);
      h2=iHigh(Symbol(),NULL,i+4);
      h1=iHigh(Symbol(),NULL,i+3);
      h0=iHigh(Symbol(),NULL,i+2);
      h11=iHigh(Symbol(),NULL,i+1);
//----
      UPBuffer[i]=0.0; DownBuffer[i]=0.0;
//----
      if (l2>l0 && l1>l0 && l0<=l11 && c2>c1 && c1>c0 && c0<c11) trend=true; // óñëîâèå äëÿ áàé
      if (h2<h0 && h1<h0 && h0>=h11 && c2<c1 && c1<c0 && c0>c11) trend=false;
      if ((! trend==old) && trend==true) UPBuffer[i]=Low[i]-5*Point;
      if ((! trend==old) && trend==false) DownBuffer[i]=High[i]+5*Point;
      old=trend;
      i--;
     }
   return(0);
  }
//+------------------------------------------------------------------+
Comments