DonchianChannel-mql-file
Download script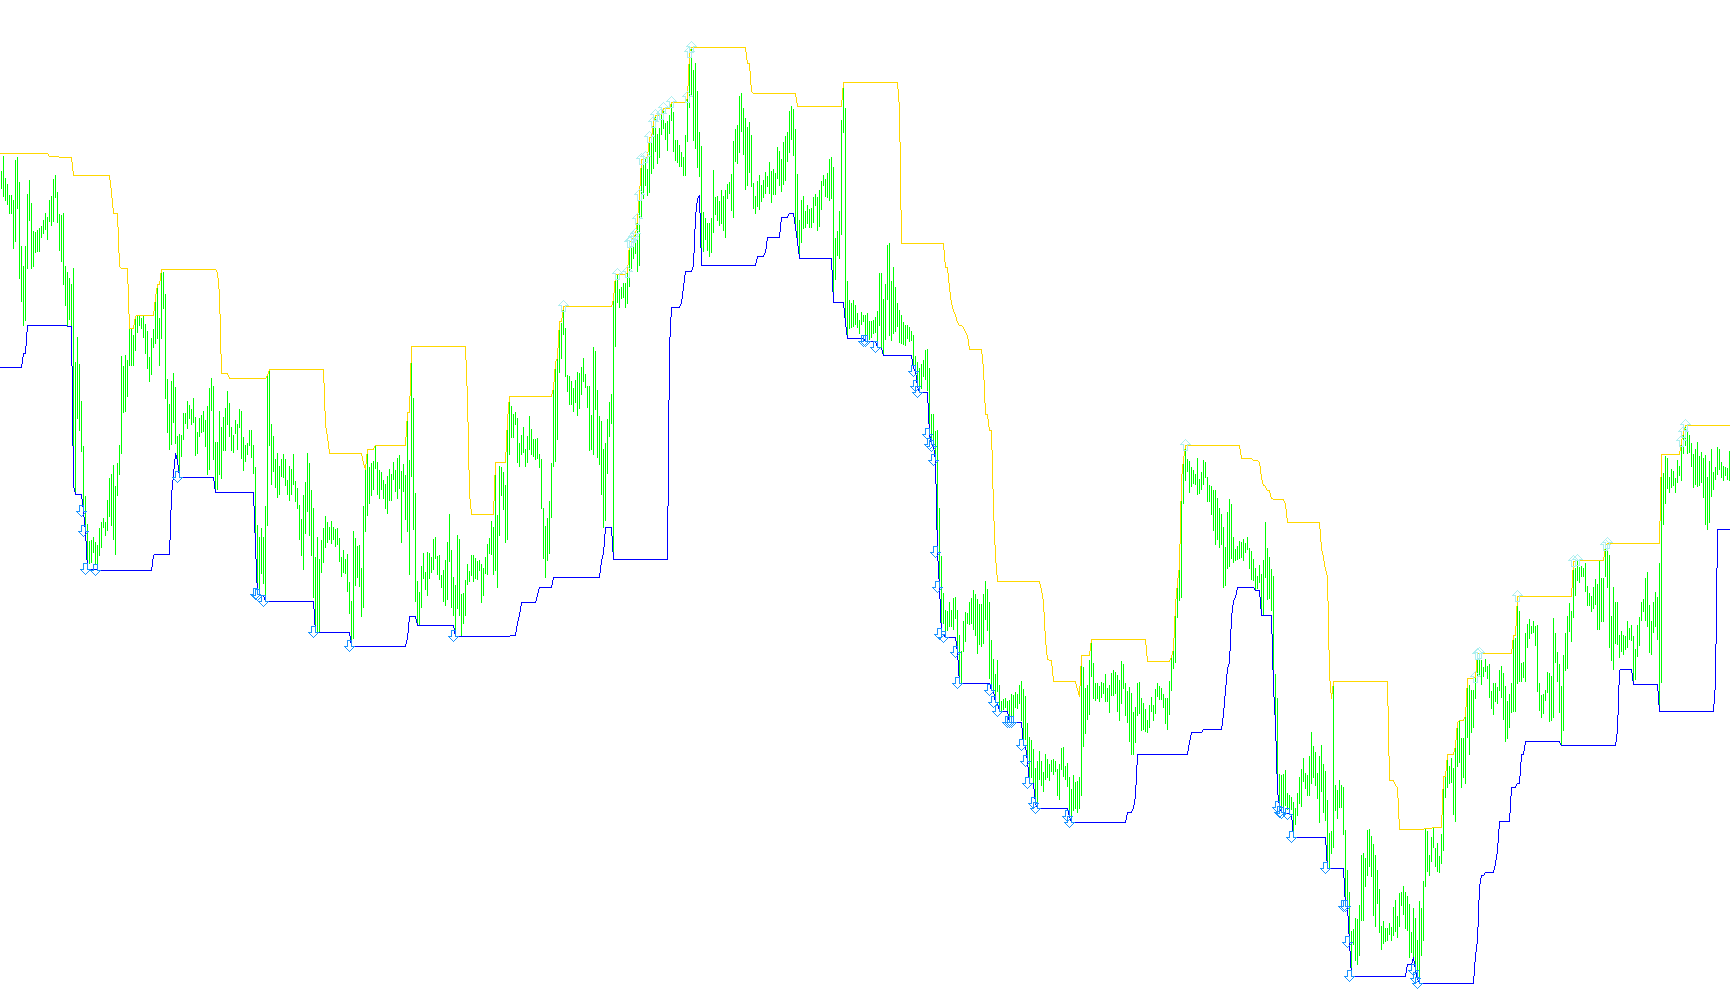
This technical tool is designed to analyze market trends by identifying specific price breakouts combined with momentum shifts. It works by layering two distinct types of market analysis: historical price boundaries (volatility) and moving average trajectories (momentum).
Core Components of the Logic
1. Price Channel Boundaries The script constantly monitors the highest and lowest prices reached over a specific look-back period. By identifying these "highs" and "lows," the tool establishes a visual boundary or "channel." This represents the current range in which the market is trading; when the price moves outside of these boundaries, it suggests a potential shift in market sentiment.
2. Momentum Angle Analysis Beyond just looking at where the price is, the script calculates the "slope" or angle of a long-term moving average. It compares the position of the average at two different points in time to determine how aggressively the price is trending. A positive angle indicates strong upward momentum, while a negative angle indicates strong downward pressure.
How the Signals Are Generated
The tool does not provide signals based on price movement alone; instead, it requires a "confluence" of two specific conditions to be met simultaneously:
-
Buy Signals (Bullish): To trigger a buy signal, the current price must break above the previous high of the price channel. However, this only triggers if the moving average also shows a sufficiently steep upward angle. This ensures that you are not just seeing a minor fluctuation, but a breakout backed by actual upward momentum.
-
Sell Signals (Bearish): To trigger a sell signal, the current price must drop below the previous low of the price channel. This is only confirmed if the moving average shows a sufficiently steep downward angle. This logic helps filter out "fake-outs" by ensuring that a downward break is accompanied by a strong enough trend to be significant.
Summary for the User
Essentially, this script acts as a momentum filter. It watches for moments when the price "breaks out" of its recent trading range and then cross-references that movement with the overall direction of the trend. If both the breakout and the trend intensity align, it marks the chart with specific visual arrows to highlight potential trading opportunities.
#property indicator_chart_window
#property indicator_buffers 4
#property indicator_color1 Black
#property indicator_color2 Black
#property indicator_color3 Green
#property indicator_color4 Red

extern int ChannelPeriod=28;
extern int EMAPeriod=120;
extern int StartEMAShift=6;
extern int EndEMAShift=0;
extern double AngleTreshold=0.32;

double UpperLine[];
double LowerLine[];
double BuyBuffer[];
double SellBuffer[];

int init()
  {
   SetIndexStyle(0,DRAW_LINE);
   SetIndexBuffer(0,UpperLine);
   SetIndexLabel(0,"UpperLine");

   SetIndexStyle(1,DRAW_LINE);
   SetIndexBuffer(1,LowerLine);
   SetIndexLabel(1,"LowerLine");

   SetIndexStyle(2,DRAW_ARROW,EMPTY);
   SetIndexArrow(2,241);
   SetIndexBuffer(2,BuyBuffer);
   SetIndexLabel(2,"Buy");

   SetIndexStyle(3,DRAW_ARROW,EMPTY);
   SetIndexArrow(3,242);
   SetIndexBuffer(3,SellBuffer);
   SetIndexLabel(3,"Sell");

   IndicatorShortName("DonchianChannel("+ChannelPeriod+")");
   SetIndexDrawBegin(0,ChannelPeriod);
   SetIndexDrawBegin(1,ChannelPeriod);
   return(0);
  }
//+------------------------------------------------------------------+
//| Price Channel                                                         |
//+------------------------------------------------------------------+
int start()
  {
   int i, start ,counted_bars=IndicatorCounted();
   int    k;
   double high,low,price, fEndMA, fStartMA, fAngle;

   if(Bars<=ChannelPeriod) return(0);

   if(counted_bars>=ChannelPeriod) {
      start=Bars-counted_bars-1;
   } else {
      start=Bars-ChannelPeriod-1;
   }

   BuyBuffer[0]=0;
   SellBuffer[0]=0;

   for(i=start;i>=0;i--) {
      UpperLine[i]=High[Highest(NULL, 0, MODE_HIGH, ChannelPeriod, i)];
      LowerLine[i]=Low[Lowest(NULL, 0, MODE_LOW, ChannelPeriod, i)];

      // next 3 lines from jpkfox, EMAAngle.mq4
      fEndMA=iMA(NULL,0,EMAPeriod,0,MODE_EMA,PRICE_MEDIAN,i+EndEMAShift);
      fStartMA=iMA(NULL,0,EMAPeriod,0,MODE_EMA,PRICE_MEDIAN,i+StartEMAShift);
      fAngle = 10000.0 * (fEndMA - fStartMA)/(StartEMAShift-EndEMAShift);


      if(UpperLine[i+1]<High[i] && fAngle > AngleTreshold) {
         BuyBuffer[i]=High[i];
      }
      if(LowerLine[i+1]>Low[i] && fAngle < -AngleTreshold) {
         SellBuffer[i]=Low[i];
      }

      if (BuyBuffer[0]!=0) {
         Print("Donchian Buy Signal at " + BuyBuffer[0] + " -> " + Symbol() + "/" + Period());
         // PlaySound("expert.wav");
      }

      if (SellBuffer[0]!=0) {
         Print("Donchian Sell Signal at " + SellBuffer[0] + " -> " + Symbol() + "/" + Period());
         // PlaySound("expert.wav");
      }

   }
  }
//+------------------------------------------------------------------+
Comments