MUV_Diff
Download script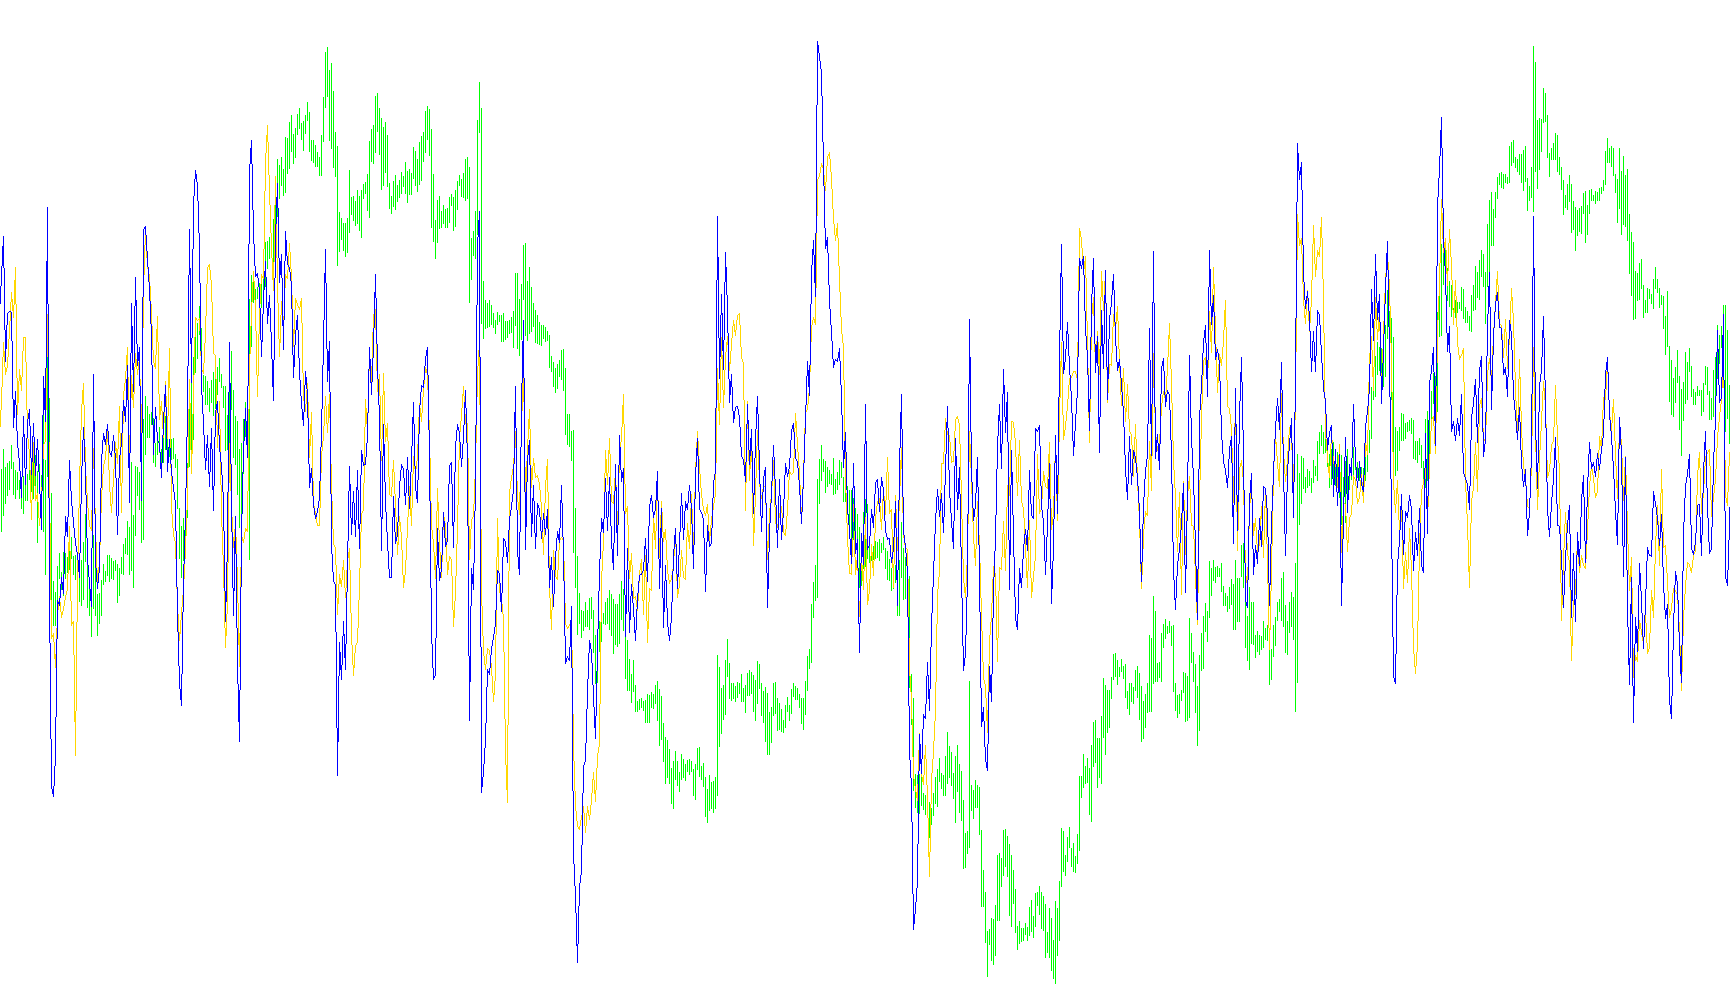
This tool is designed as a visual technical indicator for trading platforms, specifically crafted to help traders identify momentum and price movement trends. Rather than showing standard price action, it operates in a separate window below your main chart to provide a cleaner, more focused analysis of market dynamics.
How the Logic Works
The core functionality of this script relies on calculating the "rate of change" between two different data streams. Here is a breakdown of how it processes information:
- Data Source Integration: The script connects to an external calculation tool (an indicator named "MUV"). It pulls specific data points from this source based on a user-defined timeframe, which defaults to a 14-period setting.
- Comparative Analysis: Instead of simply plotting the raw values from that source, the script compares the current value against the value immediately preceding it. By subtracting the previous value from the current one, it determines the "velocity" of the movement.
- Dual Trend Tracking: The logic performs this calculation twice simultaneously:
- It tracks the first data stream (represented by a Blue line), which provides insight into the primary trend.
- It tracks the second data stream (represented by a Yellow line), allowing for a comparative view of a secondary market factor.
What This Means for the Trader
By focusing on the difference between consecutive values rather than the raw numbers, this script filters out "noise" and highlights shifts in momentum.
When you see the lines on your screen:
- A rising line indicates that the underlying movement is accelerating upwards.
- A falling line indicates a deceleration or a downward trend in the data.
- The gap between the Blue and Yellow lines helps traders visualize whether two different market forces are moving in harmony or diverging from one another.
In essence, this tool acts as a momentum speedometer, showing you not just where the price is going, but how quickly it is getting there.
//+------------------------------------------------------------------+
//|                                                          111.mq4 |
//|                      Copyright © 2008, MetaQuotes Software Corp. |
//|                                        http://www.metaquotes.net |
//+------------------------------------------------------------------+
#property copyright "Copyright © 2008, MetaQuotes Software Corp."
#property link      "http://www.metaquotes.net"

#property indicator_separate_window
#property indicator_buffers 2
#property indicator_color1 Blue
#property indicator_color2 Yellow
#property indicator_level1 0

extern int MAPeriod = 14;
//---- buffers
double ExtMapBuffer1[];
double ExtMapBuffer2[];

//+------------------------------------------------------------------+
//| Custom indicator initialization function                         |
//+------------------------------------------------------------------+
int init()
  {
//---- indicators
   SetIndexStyle(0,DRAW_LINE);
   SetIndexBuffer(0,ExtMapBuffer1);
   SetIndexStyle(1,DRAW_LINE);
   SetIndexBuffer(1,ExtMapBuffer2);
//----
   return(0);
  }
//+------------------------------------------------------------------+
//| Custom indicator deinitialization function                       |
//+------------------------------------------------------------------+
int deinit()
  {
//----

//----
   return(0);
  }
//+------------------------------------------------------------------+
//| Custom indicator iteration function                              |
//+------------------------------------------------------------------+
int start()
  {
   int    counted_bars=IndicatorCounted();
//----
  for (int i = Bars- counted_bars;i >=0; i--)
  {
  ExtMapBuffer1[i] = iCustom(NULL,0,"MUV",MAPeriod,0,1,i)-iCustom(NULL,0,"MUV",MAPeriod,0,1,i+1);
  ExtMapBuffer2[i] = iCustom(NULL,0,"MUV",MAPeriod,1,1,i)-iCustom(NULL,0,"MUV",MAPeriod,1,1,i+1);
  }
//----
   return(0);
  }
//+------------------------------------------------------------------+
Comments