DS_Stochastic
Download script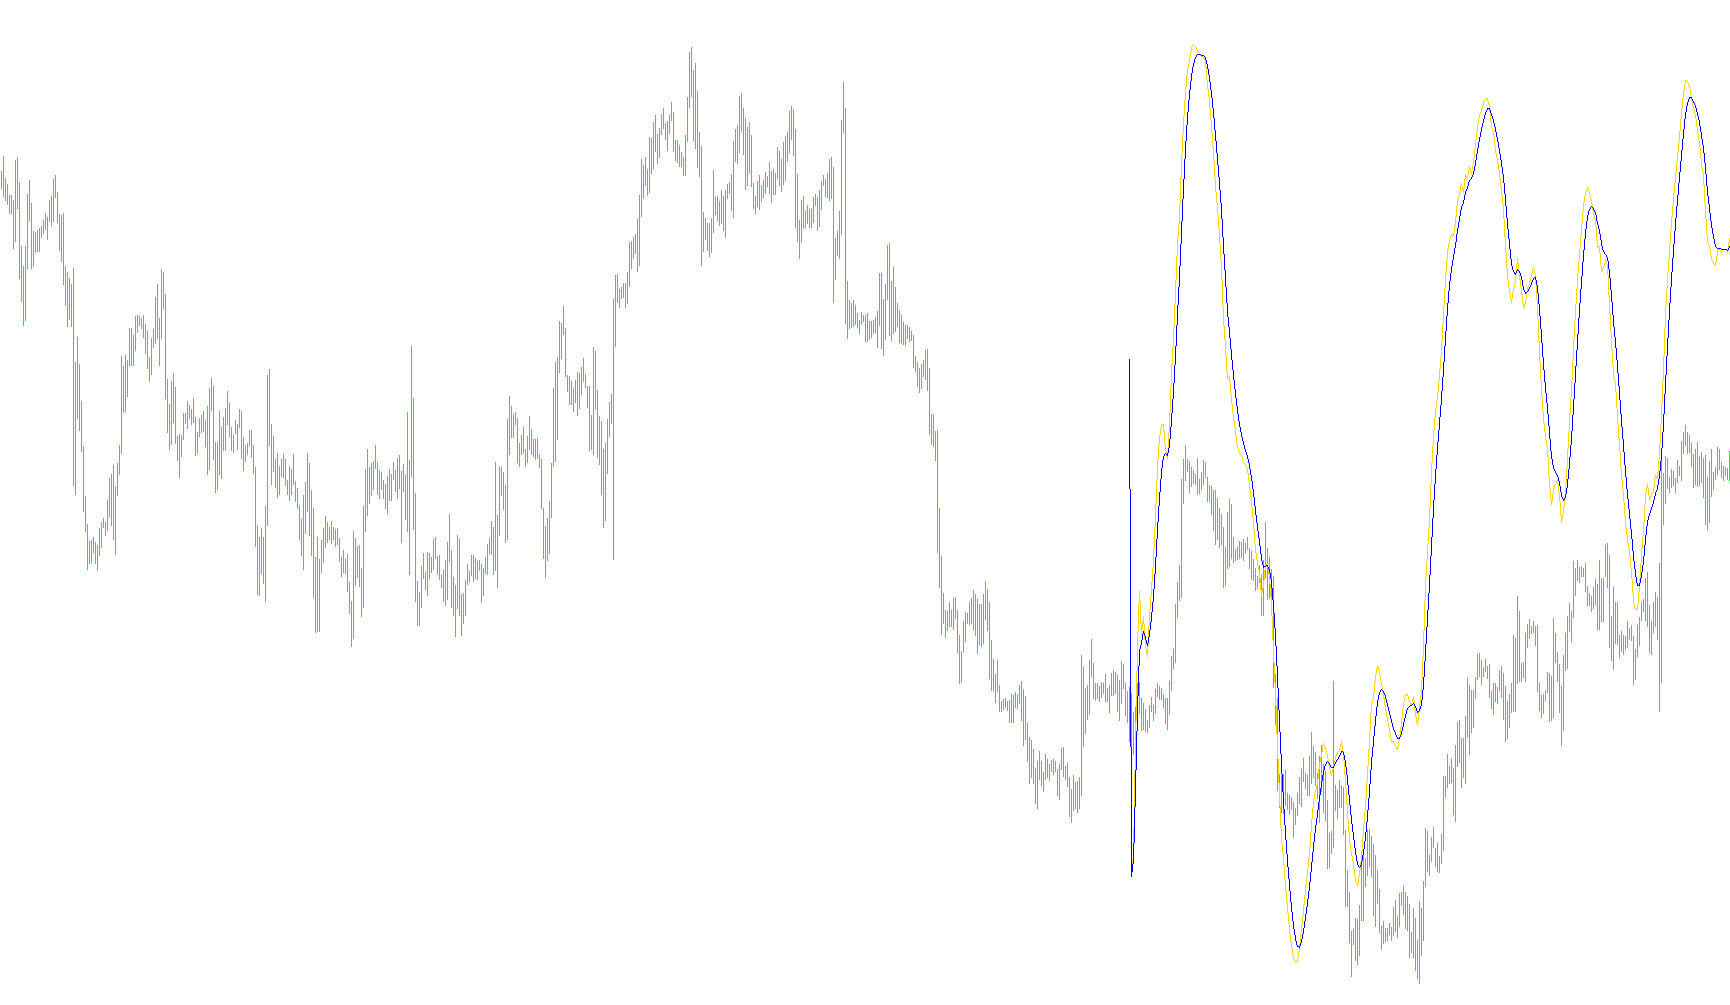
This script is a custom technical analysis tool designed to help traders identify momentum and potential reversal points in the financial markets. It functions by calculating and visualizing two distinct moving lines on a separate window below the main price chart, allowing for a clearer view of market trends independent of price volatility.
How the Logic Works
The tool operates by analyzing historical price data—specifically looking at the highs and lows over a user-defined period—to determine where the current price sits relative to recent extremes. Here is the step-by-step logic:
1. Data Collection and Range Identification The script looks back at a specific number of past bars (the "period") to identify the highest peak and the lowest valley reached during that timeframe. It then calculates the distance between the current closing price and these boundaries. This helps the tool understand if the market is currently "stretched" toward the top or bottom of its recent range.
2. Smoothing the Movement To prevent the indicator from reacting too wildly to minor, insignificant price flickers, the script applies a smoothing process. It takes the raw price data and blends it with previous values. This creates a more fluid motion, ensuring that the resulting lines represent sustained trends rather than random noise.
3. Calculating the Core Value (DS) The primary calculation determines the "relative position" of the market. By comparing the smoothed distance of the current price against its historical range, it generates a percentage-based value. This allows you to see how "overbought" or "oversold" the current price is on a scale of 0 to 100.
4. Generating the Signal Line (DS_EMA) The script then takes that core value and applies an additional moving average calculation. This creates a secondary, slower-moving line. This "Signal" line acts as a stabilizer; by comparing where the main value is relative to this signal line, traders can look for shifts in momentum—such as when the fast line crosses over the slow line.
Summary of Visual Output
When you view this on your chart, you will see two lines:
- The Primary Line: Shows the immediate momentum and current relative position of the price.
- The Signal Line: Provides a smoothed average of that momentum to help filter out market "chatter" and identify the broader direction of the trend.
//+------------------------------------------------------------------+
//|                                                DS_Stochastic.mq4 |
//|                      Copyright © 2006, MetaQuotes Software Corp. |
//|                                        http://www.metaquotes.net |
//+------------------------------------------------------------------+
#property copyright "Copyright © 2004, MetaQuotes Software Corp."
#property link "http://www.metaquotes.net/"
//----
#property indicator_separate_window
#property indicator_buffers 2
#property indicator_color1 Blue
#property indicator_color2 Red
//---- input parameters
extern int qPeriod = 13;
extern int rPeriod = 32;
extern int EMAfast = 5;
extern int CountBars = 300;
//---- buffers
double ExtMapBuffer1[];
double ExtMapBuffer2[];
//----
double krPeriod, kEMAfast;
double mtm, mtmInt, mtmIntPrev, mtm1, mtmInt1, mtmIntPrev1, DS_EMA;
double DS_EMAtopPrev, DS_EMAtop, DS_EMAbottomPrev, DS_EMAbottom, DS;
//+------------------------------------------------------------------+
//| Custom indicator initialization function                         |
//+------------------------------------------------------------------+
int init()
  {
//---- indicator lines
   SetIndexStyle(0, DRAW_LINE);
   SetIndexBuffer(0, ExtMapBuffer1);
   SetIndexStyle(1, DRAW_LINE);
   SetIndexBuffer(1, ExtMapBuffer2);
//----
   IndicatorShortName("DS_Stoch (" + qPeriod + "," + rPeriod + "," + EMAfast + ")");
   SetIndexLabel(0, "DS_Stoch");
   SetIndexLabel(1, "Signal");
//----
   krPeriod = 2 / (rPeriod + 1.0);
   kEMAfast = 2 / (EMAfast + 1.0);
//----
   return(0);
  }
//+------------------------------------------------------------------+
//| DS                                                               |
//+------------------------------------------------------------------+
int start()
  {
   int shift;
   mtmIntPrev = 0.0;
   mtmIntPrev1 = 0.0;
   DS_EMAtopPrev = 0.0;
   DS_EMAbottomPrev = 0.0;
   if(Bars < CountBars + qPeriod)
       return(0);
   for(shift = CountBars; shift >= 0; shift--)
     {
       mtm = Close[shift] - Low[Lowest(NULL, 0, MODE_LOW, qPeriod, shift)];
       if(mtm == 0)
           mtm = Point;
       mtm1 = High[Highest(NULL, 0, MODE_HIGH, qPeriod, shift)] -
              Low[Lowest(NULL, 0, MODE_LOW, qPeriod, shift)];
       if(mtm1 == 0)
           mtm1 = Point;
       mtmInt = mtmIntPrev + krPeriod*(mtm - mtmIntPrev);
       mtmInt1 = mtmIntPrev1 + krPeriod*(mtm1 - mtmIntPrev1);
       DS_EMAtop = DS_EMAtopPrev + kEMAfast*(mtmInt - DS_EMAtopPrev);
       DS_EMAbottom = DS_EMAbottomPrev + kEMAfast*(mtmInt1 - DS_EMAbottomPrev);
       if(!CompareDouble(mtmInt1, 0.0))
           DS = 100*mtmInt / mtmInt1;
       if(!CompareDouble(DS_EMAbottom, 0.0))
           DS_EMA = 100*DS_EMAtop / DS_EMAbottom;
       ExtMapBuffer1[shift] = DS;
       ExtMapBuffer2[shift] = DS_EMA;
       mtmIntPrev = mtmInt;
       mtmIntPrev1 = mtmInt1;
       DS_EMAtopPrev = DS_EMAtop;
       DS_EMAbottomPrev = DS_EMAbottom;
     }
//----
   return(0);
  }
//+------------------------------------------------------------------+
//| Ôóíêöèÿ ñðàíåíèÿ äâóõ âåùåñòâåííûõ ÷èñåë.                        |
//+------------------------------------------------------------------+
bool CompareDouble (double Number1, double Number2)
  {
    bool Compare = NormalizeDouble(Number1 - Number2, 8) == 0;
    return(Compare);
  }
//+------------------------------------------------------------------+
Comments