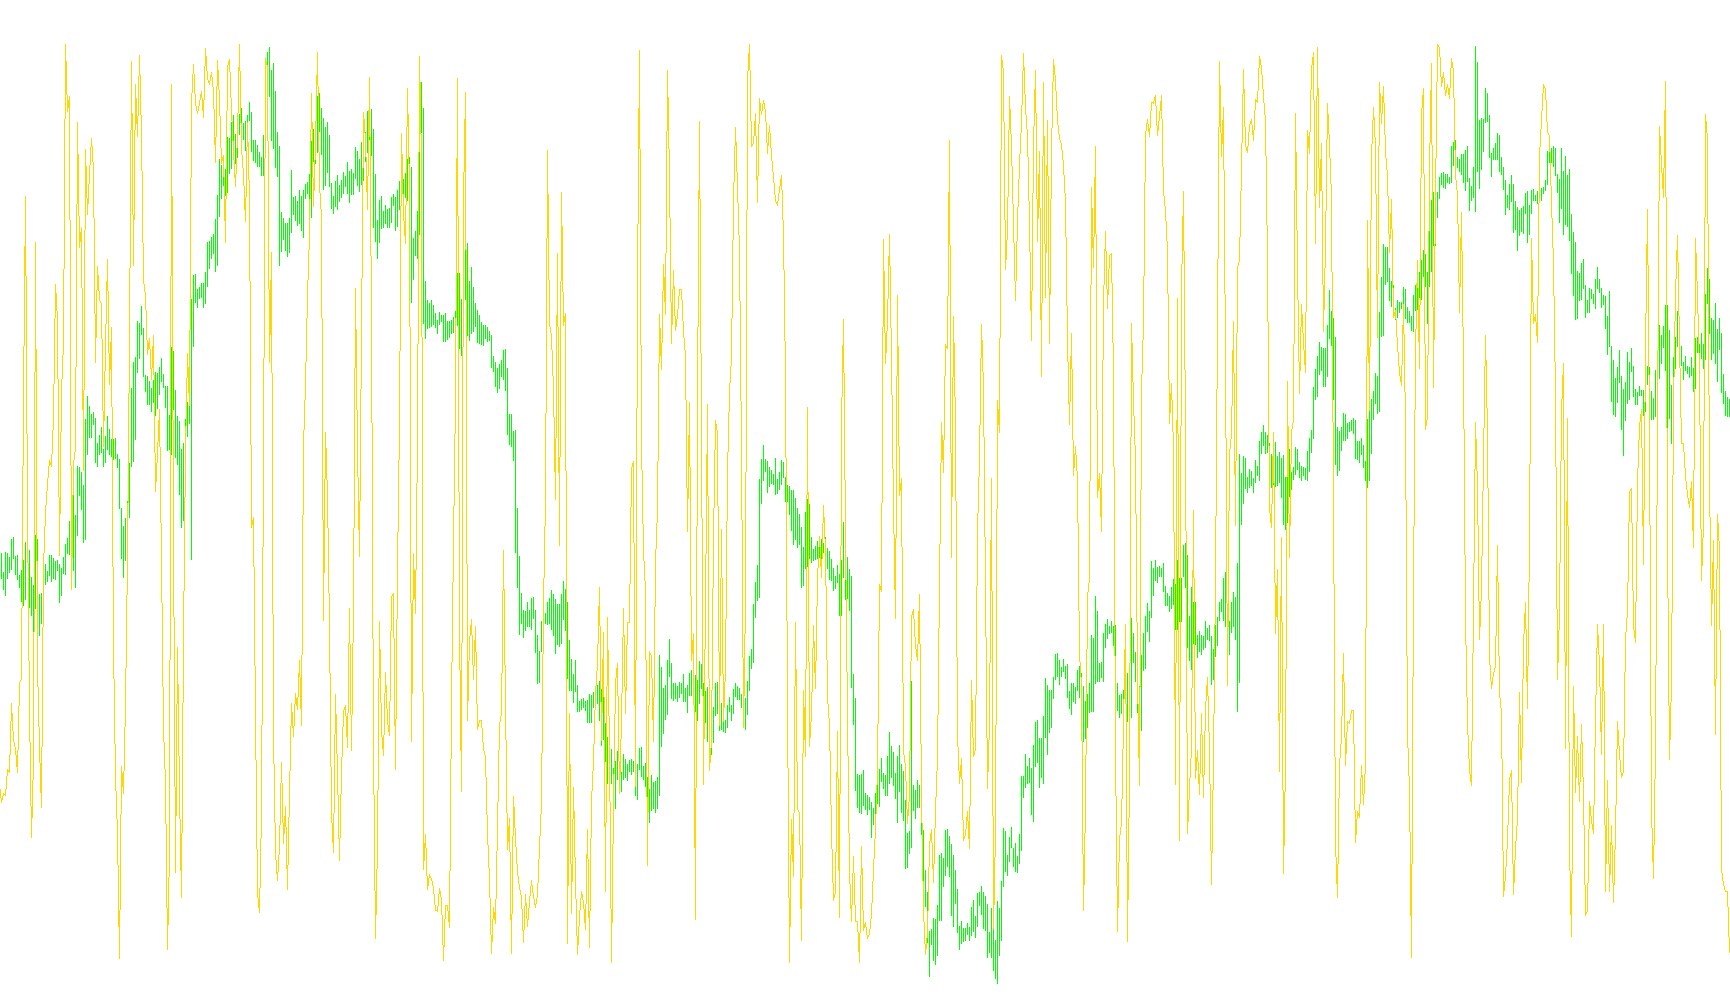
This script functions as a specialized technical analysis tool designed to help traders understand the relative position of a currency pair's current price within a specific recent timeframe. It visualizes this relationship on a separate scale below the main price chart, providing a clear perspective on whether an asset is currently "expensive" or "cheap" compared to its recent history.
How the Logic Works
The core logic of the tool revolves around identifying three key price points over a set period (defaulting to the last 14 candles):
- The Peak: It identifies the highest price reached during that period.
- The Valley: It identifies the lowest price reached during that same period.
- The Current Position: It looks at the current closing price.
By identifying these three points, the script calculates the "range" of the market movement. It then determines exactly where the current price sits within that range as a percentage.
Visual Representation and Interpretation
The results are displayed as a continuous line moving between -100 and 0. This scale allows traders to see the momentum of the market:
- Near -100: When the line moves toward the bottom of the scale, it indicates that the current price is very close to the recent low. This often suggests that the asset is being heavily sold or is reaching an oversold state.
- Moving Toward 0: As the line climbs, it shows that the price is moving away from the lows and approaching the recent highs.
- Near 0: When the line reaches the top of its range, it indicates that the current price is near its recent peak. This may suggest that the asset is being heavily bought or is reaching an overbought state.
Key Technical Behavior
- Data Smoothing: The script is designed to wait until enough historical data has accumulated (matching the user-defined period) before it begins to draw a line, ensuring that the initial readings are based on a complete and accurate set of price points.
- Precision Handling: The logic includes a specific check to ensure that if there is no movement in the price range (i.e., the high and low are identical), the script remains stable and does not produce mathematical errors.
- Dynamic Updating: The tool constantly scans the most recent candles to recalculate these percentages, allowing for real-time monitoring of market trends as new prices appear on the chart.
//+------------------------------------------------------------------+
//| Williams Percent Range.mq4 |
//| Copyright © 2005, MetaQuotes Software Corp. |
//| http://www.metaquotes.net/ |
//+------------------------------------------------------------------+
#property copyright "Copyright © 2005, MetaQuotes Software Corp."
#property link "http://www.metaquotes.net/"
//----
#property indicator_separate_window
#property indicator_minimum -100
#property indicator_maximum 0
#property indicator_buffers 1
#property indicator_color1 DodgerBlue
#property indicator_level1 -20
#property indicator_level2 -80
//---- input parameters
extern int ExtWPRPeriod = 14;
//---- buffers
double ExtWPRBuffer[];
//+------------------------------------------------------------------+
//| Custom indicator initialization function |
//+------------------------------------------------------------------+
int init()
{
string sShortName;
//---- indicator buffer mapping
SetIndexBuffer(0, ExtWPRBuffer);
//---- indicator line
SetIndexStyle(0, DRAW_LINE);
//---- name for DataWindow and indicator subwindow label
sShortName="%R(" + ExtWPRPeriod + ")";
IndicatorShortName(sShortName);
SetIndexLabel(0, sShortName);
//---- first values aren't drawn
SetIndexDrawBegin(0, ExtWPRPeriod);
//----
return(0);
}
//+------------------------------------------------------------------+
//| Williams Percent Range |
//+------------------------------------------------------------------+
int start()
{
int i, nLimit, nCountedBars;
//---- insufficient data
if(Bars <= ExtWPRPeriod)
return(0);
//---- bars count that does not changed after last indicator launch.
nCountedBars = IndicatorCounted();
//----Williams Percent Range calculation
i = Bars - ExtWPRPeriod - 1;
if(nCountedBars > ExtWPRPeriod)
i = Bars - nCountedBars - 1;
while(i >= 0)
{
double dMaxHigh = High[Highest(NULL, 0, MODE_HIGH, ExtWPRPeriod, i)];
double dMinLow = Low[Lowest(NULL, 0, MODE_LOW, ExtWPRPeriod, i)];
if(!CompareDouble((dMaxHigh - dMinLow), 0.0))
ExtWPRBuffer[i] = -100*(dMaxHigh - Close[i]) / (dMaxHigh - dMinLow);
i--;
}
//----
return(0);
}
//+------------------------------------------------------------------+
//| Ôóíêöèÿ ñðàíåíèÿ äâóõ âåùåñòâåííûõ ÷èñåë. |
//+------------------------------------------------------------------+
bool CompareDouble(double Number1, double Number2)
{
bool Compare = NormalizeDouble(Number1 - Number2, 8) == 0;
return(Compare);
}
//+------------------------------------------------------------------+
Comments