DT-RSI-Sig
Download script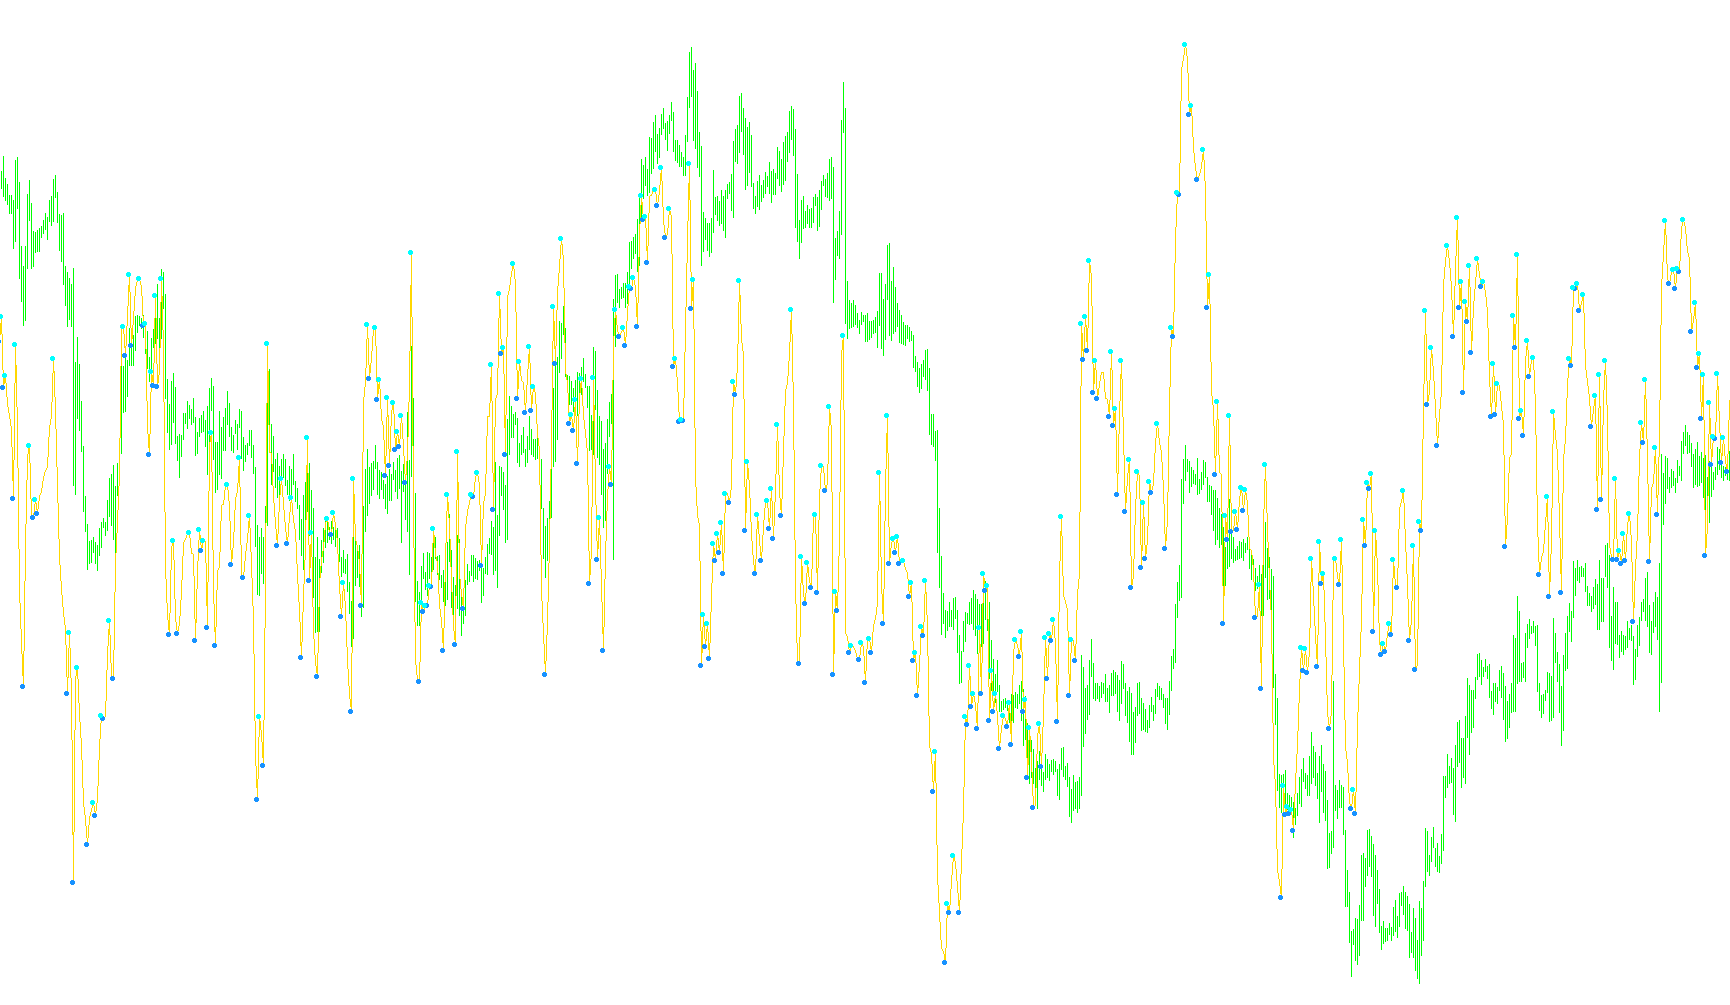
This script is a specialized technical analysis tool designed to identify market trends and generate specific entry signals based on the Relative Strength Index (RSI). Unlike a standard RSI which simply measures momentum, this logic adds layers of complexity to filter out "noise" and identify significant structural shifts in price movement.
Core Logic and Mechanism
1. Peak and Trough Identification The script continuously monitors the RSI values to identify local "peaks" (high points) and "troughs" (low points). It doesn't just look for any high or low; it specifically tracks these points based on whether the momentum is reversing.
- Highs: It identifies points where the momentum reaches a peak and begins to turn downward.
- Lows: It identifies points where the momentum reaches a valley and begins to turn upward.
2. Trend Validation (The Filtering System) One of the primary features of this logic is its strict validation process. To ensure that the signals are not generated during flat or unpredictable markets, the script applies "threshold" rules:
- For Upward Trends, the script validates that specific high points are above a certain level (e.g., 40 and 60). If the price action is too low to meet these criteria, the tool assumes the trend has changed or is invalid and will not draw trend lines.
- For Downward Trends, it performs a similar check at different levels. This ensures that the resulting visual trends only appear when there is enough significant movement to justify a "trend."
3. Signal Generation Logic Once the script identifies a valid trend, it uses mathematical projection to create entry signals:
- Buy Signals: These occur when the RSI shows a recovery from a confirmed low point. The logic checks if the current momentum is crossing above a projected value derived from previous highs and lows. It specifically looks for the momentum to be in a "rebound" zone (above 40 but below 50).
- Sell Signals: Conversely, these occur when the RSI shows a decline from a confirmed high point. The logic looks for the momentum to be crossing below a projected value while situated in the upper half of the indicator range.
Visual Output
To make this data easy for a user to interpret, the script performs three visual tasks:
- Trend Lines: It draws actual trend lines on the chart (Blue for Buy trends, Red for Sell trends). These lines connect the confirmed peaks and troughs identified by the logic.
- Dynamic Arrows: It places specific markers on the chart to highlight exactly where the mathematical "Buy" or "Sell" conditions have been met.
- Separate Window Display: The RSI itself is plotted in a separate window, allowing the user to see the underlying momentum and the calculation of the peaks/troughs simultaneously.
Summary for the User
Essentially, this tool acts as a filter. It looks at the raw "heartbeat" of the market (RSI), identifies the major "breaths" (peaks and troughs), filters out insignificant movements using specific numerical thresholds, and then draws clear visual lines and arrows to tell you when the momentum suggests it is time to act.
//+------------------------------------------------------------------+
//|                                                   DT-RSI-Sig.mq4 |
//+------------------------------------------------------------------+
#property copyright "klot"
#property link      "klot@mail.ru"

#property indicator_separate_window
#property indicator_minimum 20
#property indicator_maximum 80
#property indicator_buffers 5
#property indicator_color1 Aqua
#property indicator_color2 Red
#property indicator_color3 Blue
#property indicator_color4 Red
#property indicator_color5 Blue
//---- input parameters
extern int       PeriodRSI=14;
//---- buffers
double ExtMapBuffer1[];
double ExtMapBuffer2[];
double ExtMapBuffer3[];
double ExtMapBuffer4[];
double ExtMapBuffer5[];
//+------------------------------------------------------------------+
//| Custom indicator initialization function                         |
//+------------------------------------------------------------------+
int init()
  {
//---- indicators
   SetIndexStyle(0,DRAW_LINE);
   SetIndexBuffer(0,ExtMapBuffer1);
   SetIndexStyle(1,DRAW_ARROW);
   SetIndexArrow(1,242);
   SetIndexBuffer(1,ExtMapBuffer2);
   SetIndexEmptyValue(1,0.0);
   SetIndexStyle(2,DRAW_ARROW);
   SetIndexArrow(2,241);
   SetIndexBuffer(2,ExtMapBuffer3);
   SetIndexEmptyValue(2,0.0);
   SetIndexStyle(3,DRAW_ARROW);
   SetIndexArrow(3,159);
   SetIndexBuffer(3,ExtMapBuffer4);
   SetIndexEmptyValue(3,0.0);
   SetIndexStyle(4,DRAW_ARROW);
   SetIndexArrow(4,159);
   SetIndexBuffer(4,ExtMapBuffer5);
   SetIndexEmptyValue(4,0.0);
//----
   return(0);
  }
//+------------------------------------------------------------------+
//| Custor indicator deinitialization function                       |
//+------------------------------------------------------------------+
int deinit()
  {
//----
      ObjectsDeleteAll(1, OBJ_TREND);
   	ObjectsRedraw();
//----
   return(0);
  }
//+------------------------------------------------------------------+
//| Custom indicator iteration function                              |
//+------------------------------------------------------------------+
int start()
  {
   int    k,limit,pos1,pos2,pos3,pos4;
   int    counted_bars=IndicatorCounted();
   double rsi1,rsi2,rsi3,vol1,vol2,vol3,vol4;
//----
if (counted_bars<0) return(-1);

   if (counted_bars>0) counted_bars--;

   limit=Bars-counted_bars;

   for (int i=0; i<limit; i++)
      {
         ExtMapBuffer1[i]=iRSI(NULL,0,PeriodRSI,PRICE_CLOSE,i);

         rsi1=iRSI(NULL,0,PeriodRSI,PRICE_CLOSE,i+1);
         rsi2=iRSI(NULL,0,PeriodRSI,PRICE_CLOSE,i+2);
         rsi3=iRSI(NULL,0,PeriodRSI,PRICE_CLOSE,i+3);

         if  (rsi1<rsi2 && rsi2>rsi3) ExtMapBuffer5[i+2]=rsi2; //Âåðõóøêà. RSI ïîâîðà÷èâàåò âíèç
         if  (rsi1>rsi2 && rsi2<rsi3) ExtMapBuffer4[i+2]=rsi2; //Äîíûøêî. RSI ïîâîðà÷èâàåò ââåðõ
      }
      //------ Ïîèñê âåðõóøåê ------
   k=0;
   for (i=0; i<500; i++)
      {
         if (ExtMapBuffer5[i]>40 && k==0) { vol1=ExtMapBuffer5[i]; pos1=i; k++;}
         if (ExtMapBuffer5[i]>60 && ExtMapBuffer5[i]>vol1 && k!=0) { vol2=ExtMapBuffer5[i]; pos2=i; k++;}
         if (k>1) break;
      }
   // Åñëè åñòü ìèíèìóì íèæå 40, òî ëèíèþ òðåíäà íå ñòðîèì, ò.ê. ñ÷èòàåì ÷òî íàïðàâëåíèå òðåíäà èçìåíèëîñü
   for (i=0; i<pos2; i++)
   {
   if ( ExtMapBuffer4[i]!=0 && ExtMapBuffer4[i]<40) {vol1=0; vol2=0;}
   }
      //----- Ïîèñê äîíûøåê ------
    k=0;
   for (i=0; i<500; i++)
      {
         if (ExtMapBuffer4[i]<60 && ExtMapBuffer4[i]!=0 && k==0) { vol3=ExtMapBuffer4[i]; pos3=i; k++;}
         if (ExtMapBuffer4[i]!=0 && ExtMapBuffer4[i]<40 && ExtMapBuffer4[i]<vol3 && k!=0) { vol4=ExtMapBuffer4[i]; pos4=i; k++;}
         if (k>1) break;
      }
   // Åñëè åñòü ìàêñèìóì áîëüøå 60, òîãäà ëèíèþ òðåíäà íå ñòðîèì, ò.ê. ñ÷èòàåì ÷òî íàïðàâëåíèå òðåíäà èçìåíèëîñü
   for (i=0; i<pos4; i++)
   {
   if ( ExtMapBuffer5[i]!=0 && ExtMapBuffer5[i]>60) {vol3=0; vol4=0;}
   }

    // ---- Ñèãíàëû äëÿ âõîäîâ Buy è Sell
         rsi1=iRSI(NULL,0,PeriodRSI,PRICE_CLOSE,1);
         rsi2=iRSI(NULL,0,PeriodRSI,PRICE_CLOSE,2);

      //------------
      double volDW,volDW1,volDW2,volUP,volUP1,volUP2;
      if (vol3!=0 && vol4!=0)
      {
      volDW=vol3+((pos3)*(vol3-vol4)/(pos4-pos3));
      volDW1=vol3+((pos3-1)*(vol3-vol4)/(pos4-pos3));
      volDW2=vol3+((pos3-2)*(vol3-vol4)/(pos4-pos3));
      }
      if (volDW!=0 && rsi2>50 && rsi1<volDW1 && rsi2>volDW2 ) ExtMapBuffer2[0]=volDW; // Ñèãíàë Sell
      //------------
      //------------
      if (vol1!=0 && vol2!=0)
		{
		volUP=vol1+(pos1*(vol1-vol2)/(pos2-pos1));
		volUP1=vol1+((pos1-1)*(vol1-vol2)/(pos2-pos1));
		volUP2=vol1+((pos1-2)*(vol1-vol2)/(pos2-pos1));
		}
		if (volUP!=0 && rsi2<50 && rsi2>40 && rsi1>volUP1 && rsi2<volUP2 ) ExtMapBuffer3[0]=volUP; // Ñèãíàë Buy
		//------------
	/*
    Comment(" vol1 = ",vol1, "  pos1 = ",pos1,"\n",
           " vol2 = ",vol2, "  pos2 = ",pos2,"\n",
           " vol3 = ",vol3, "  pos3 = ",pos3,"\n",
           " vol4 = ",vol4, "  pos4 = ",pos4,"\n",
           "   VOLDW = ", volDW,"\n",
           "   VOLUP = ", volUP, "\n") ;
    */
      ObjectsDeleteAll(1, OBJ_TREND);
      ObjectsRedraw();
      if (vol3!=0 && vol4!=0 )
      {
      ObjectCreate("Sell",OBJ_TREND,1,Time[pos4],vol4,Time[pos3],vol3);
		ObjectSet("Sell",OBJPROP_COLOR,Red);
		ObjectSet("Sell",OBJPROP_WIDTH,2);
		ObjectSet("Sell",OBJPROP_STYLE,STYLE_SOLID);
		}
		if (vol1!=0 && vol2!=0 )
		{
		ObjectCreate("Buy",OBJ_TREND,1,Time[pos2],vol2,Time[pos1],vol1);
		ObjectSet("Buy",OBJPROP_COLOR,Blue);
		ObjectSet("Buy",OBJPROP_WIDTH,2);
		ObjectSet("Buy",OBJPROP_STYLE,STYLE_SOLID);
		}

//----
   return(0);
  }
//+------------------------------------------------------------------+
Comments