DT-RSI-Sig_v2
Download script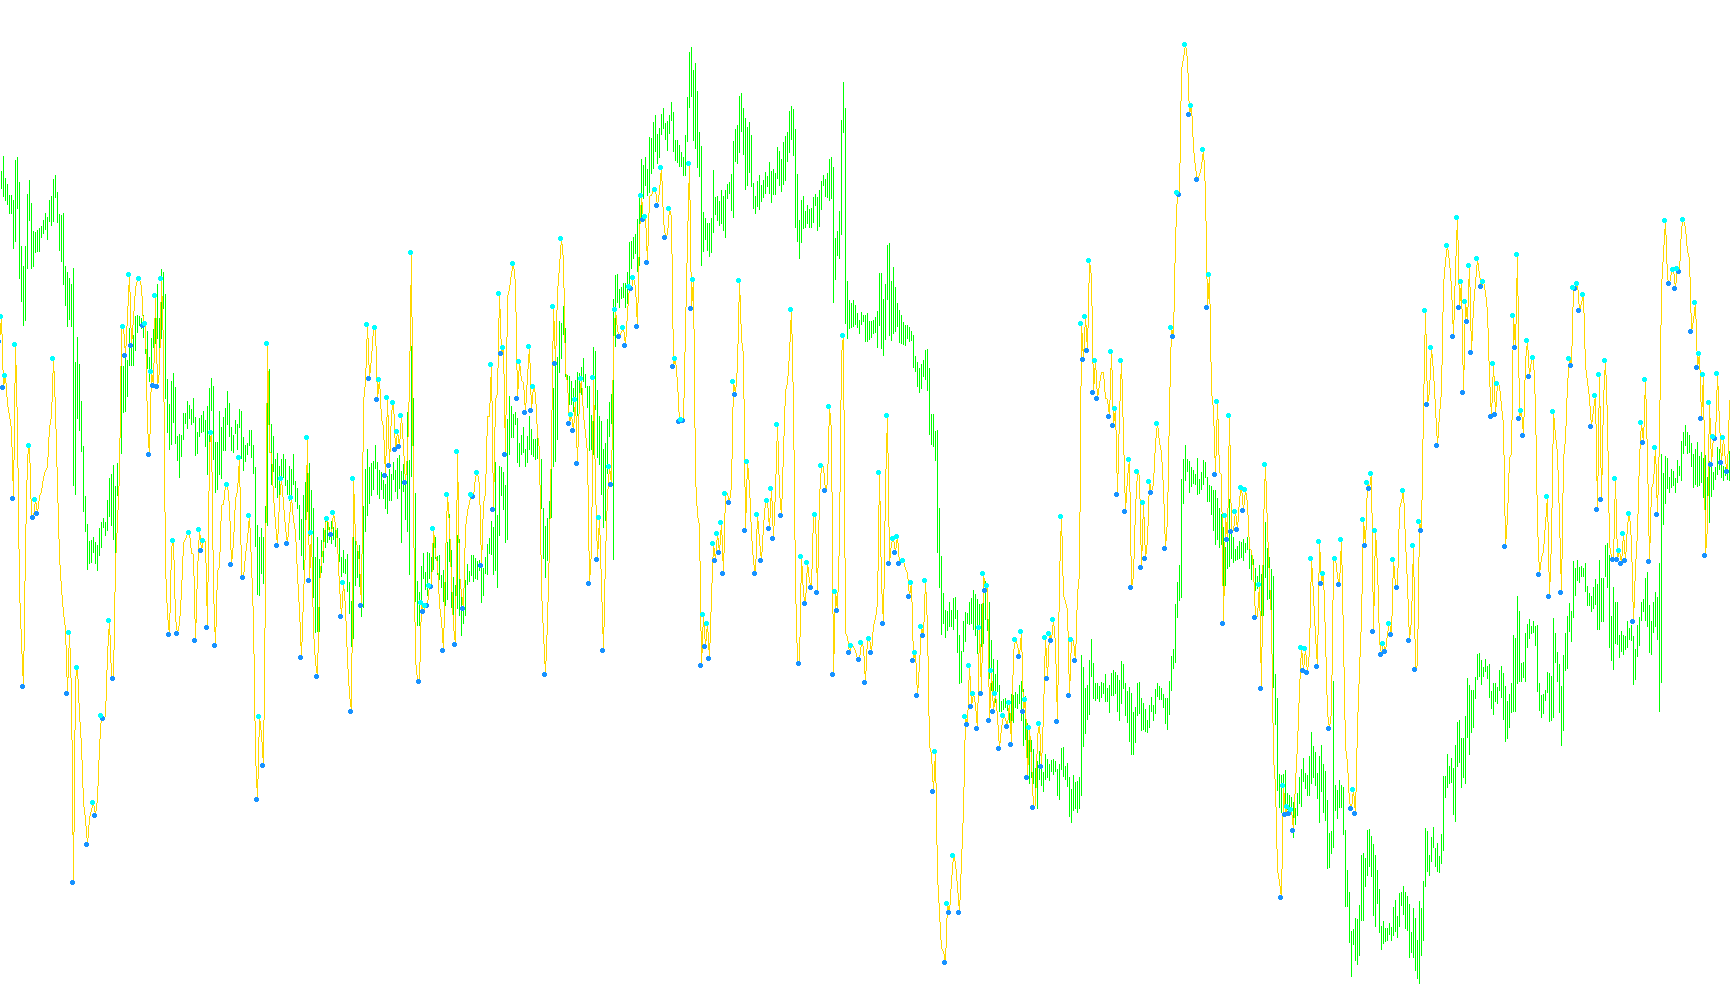
This script is a custom technical analysis tool designed for the MetaTrader platform. It functions by analyzing price momentum and identifying specific structural "peaks" and "troughs" to generate visual trading signals.
Core Mechanism
The logic primarily revolves around the Relative Strength Index (RSI), which is a standard momentum oscillator. Instead of simply looking at where the RSI sits in relation to overbought or oversold levels, this script performs a deeper geometric analysis of the RSI's movement:
- Trend Identification: The script continuously monitors the direction of the RSI. It identifies when the momentum "turns" by detecting local highs and local lows in the data stream.
- Peak and Trough Filtering: The tool searches for significant price turns based on specific thresholds. It looks for high points (peaks) that cross above a certain value (60) and low points (troughs) that drop below a certain value (40).
- Validation Logic: To ensure the signals are reliable, the script includes a "validation" check. If it finds a peak or trough, it scans the preceding price action to ensure the trend hasn't already shifted in the opposite direction. This helps filter out "noise" and ensures that only significant structural turns are highlighted.
Visual Signals
The script provides three primary visual outputs on your chart:
-
Trend Lines:
- Blue Lines (Buy): These are drawn automatically to connect significant low points (troughs) when the script identifies a potential upward movement.
- Red Lines (Sell): These are drawn to connect significant high points (peaks) when the script identifies a potential downward movement.
-
Dynamic Entry Arrows: The tool calculates a specific projected value based on the slope of the identified peaks and troughs. It then looks for a "crossing" behavior:
- Buy Signal: Triggered when the RSI is in a neutral-to-low zone (below 50) and its current trajectory crosses upward through the calculated trend line.
- Sell Signal: Triggered when the RSI is in a neutral-to-high zone (above 50) and its current trajectory crosses downward through the calculated trend line.
Summary for the User
In plain terms, this script acts as a "trend-following" assistant. It ignores minor fluctuations and waits for the market to establish clear structural turns. Once it identifies a major peak or trough, it draws a physical trend line on your screen and places an arrow (signal) when the momentum actually breaks through that line, suggesting that a new trend move has begun.
/*-----------------------------+
|			       |
| Shared by www.Aptrafx.com    |
|			       |
+------------------------------*/

//+------------------------------------------------------------------+
//|                                                   DT-RSI-Sig.mq4 |
//+------------------------------------------------------------------+
#property copyright "klot"
#property link      "klot@mail.ru"

#property indicator_separate_window
#property indicator_minimum 20
#property indicator_maximum 80
#property indicator_buffers 5
#property indicator_color1 Aqua
#property indicator_color2 Red
#property indicator_color3 Blue
#property indicator_color4 Red
#property indicator_color5 Blue
//---- input parameters
extern int       PeriodRSI=14;
//---- buffers
double ExtMapBuffer1[];
double ExtMapBuffer2[];
double ExtMapBuffer3[];
double ExtMapBuffer4[];
double ExtMapBuffer5[];
//+------------------------------------------------------------------+
//| Custom indicator initialization function                         |
//+------------------------------------------------------------------+
int init()
  {
//---- indicators
   SetIndexStyle(0,DRAW_LINE);
   SetIndexBuffer(0,ExtMapBuffer1);
   SetIndexStyle(1,DRAW_ARROW);
   SetIndexArrow(1,242);
   SetIndexBuffer(1,ExtMapBuffer2);
   SetIndexEmptyValue(1,0.0);
   SetIndexStyle(2,DRAW_ARROW);
   SetIndexArrow(2,241);
   SetIndexBuffer(2,ExtMapBuffer3);
   SetIndexEmptyValue(2,0.0);
   SetIndexStyle(3,DRAW_ARROW);
   SetIndexArrow(3,159);
   SetIndexBuffer(3,ExtMapBuffer4);
   SetIndexEmptyValue(3,0.0);
   SetIndexStyle(4,DRAW_ARROW);
   SetIndexArrow(4,159);
   SetIndexBuffer(4,ExtMapBuffer5);
   SetIndexEmptyValue(4,0.0);
//----
   return(0);
  }
//+------------------------------------------------------------------+
//| Custor indicator deinitialization function                       |
//+------------------------------------------------------------------+
int deinit()
  {
//----
      ObjectsDeleteAll(1, OBJ_TREND);
   	ObjectsRedraw();
//----
   return(0);
  }
//+------------------------------------------------------------------+
//| Custom indicator iteration function                              |
//+------------------------------------------------------------------+
int start()
  {
   int    k,limit,pos1,pos2,pos3,pos4;
   int    counted_bars=IndicatorCounted();
   double rsi1,rsi2,rsi3,vol1,vol2,vol3,vol4;
//----
if (counted_bars<0) return(-1);

   if (counted_bars>0) counted_bars--;

   limit=Bars-counted_bars;

   for (int i=0; i<limit; i++)
      {
         ExtMapBuffer1[i]=iRSI(NULL,0,PeriodRSI,PRICE_CLOSE,i);

         rsi1=iRSI(NULL,0,PeriodRSI,PRICE_CLOSE,i+1);
         rsi2=iRSI(NULL,0,PeriodRSI,PRICE_CLOSE,i+2);
         rsi3=iRSI(NULL,0,PeriodRSI,PRICE_CLOSE,i+3);

         if  (rsi1<rsi2 && rsi2>rsi3) ExtMapBuffer5[i+2]=rsi2; //Âåðõóøêà. RSI ïîâîðà÷èâàåò âíèç
         if  (rsi1>rsi2 && rsi2<rsi3) ExtMapBuffer4[i+2]=rsi2; //Äîíûøêî. RSI ïîâîðà÷èâàåò ââåðõ
      }
      //------ Ïîèñê âåðõóøåê ------
   k=0;
   for (i=0; i<500; i++)
      {
         if (ExtMapBuffer5[i]>40 && k==0) { vol1=ExtMapBuffer5[i]; pos1=i; k++;}
         if (ExtMapBuffer5[i]>60 && ExtMapBuffer5[i]>vol1 && k!=0) { vol2=ExtMapBuffer5[i]; pos2=i; k++;}
         if (k>1) break;
      }
   // Åñëè åñòü ìèíèìóì íèæå 40, òî ëèíèþ òðåíäà íå ñòðîèì, ò.ê. ñ÷èòàåì ÷òî íàïðàâëåíèå òðåíäà èçìåíèëîñü
   for (i=0; i<pos2; i++)
   {
   if ( ExtMapBuffer4[i]!=0 && ExtMapBuffer4[i]<40) {vol1=0; vol2=0;}
   }
      //----- Ïîèñê äîíûøåê ------
    k=0;
   for (i=0; i<500; i++)
      {
         if (ExtMapBuffer4[i]<60 && ExtMapBuffer4[i]!=0 && k==0) { vol3=ExtMapBuffer4[i]; pos3=i; k++;}
         if (ExtMapBuffer4[i]!=0 && ExtMapBuffer4[i]<40 && ExtMapBuffer4[i]<vol3 && k!=0) { vol4=ExtMapBuffer4[i]; pos4=i; k++;}
         if (k>1) break;
      }
   // Åñëè åñòü ìàêñèìóì áîëüøå 60, òîãäà ëèíèþ òðåíäà íå ñòðîèì, ò.ê. ñ÷èòàåì ÷òî íàïðàâëåíèå òðåíäà èçìåíèëîñü
   for (i=0; i<pos4; i++)
   {
   if ( ExtMapBuffer5[i]!=0 && ExtMapBuffer5[i]>60) {vol3=0; vol4=0;}
   }

    // ---- Ñèãíàëû äëÿ âõîäîâ Buy è Sell
         rsi1=iRSI(NULL,0,PeriodRSI,PRICE_CLOSE,1);
         rsi2=iRSI(NULL,0,PeriodRSI,PRICE_CLOSE,2);

      //------------
      double volDW,volDW1,volDW2,volUP,volUP1,volUP2;
      if (vol3!=0 && vol4!=0)
      {
      volDW=vol3+((pos3)*(vol3-vol4)/(pos4-pos3));
      volDW1=vol3+((pos3-1)*(vol3-vol4)/(pos4-pos3));
      volDW2=vol3+((pos3-2)*(vol3-vol4)/(pos4-pos3));
      }
      if (volDW!=0 && rsi2>50 && rsi1<volDW1 && rsi2>volDW2 ) ExtMapBuffer2[0]=volDW; // Ñèãíàë Sell
      //------------
      //------------
      if (vol1!=0 && vol2!=0)
		{
		volUP=vol1+(pos1*(vol1-vol2)/(pos2-pos1));
		volUP1=vol1+((pos1-1)*(vol1-vol2)/(pos2-pos1));
		volUP2=vol1+((pos1-2)*(vol1-vol2)/(pos2-pos1));
		}
		if (volUP!=0 && rsi2<50 && rsi2>40 && rsi1>volUP1 && rsi2<volUP2 ) ExtMapBuffer3[0]=volUP; // Ñèãíàë Buy
		//------------
	/*
    Comment(" vol1 = ",vol1, "  pos1 = ",pos1,"\n",
           " vol2 = ",vol2, "  pos2 = ",pos2,"\n",
           " vol3 = ",vol3, "  pos3 = ",pos3,"\n",
           " vol4 = ",vol4, "  pos4 = ",pos4,"\n",
           "   VOLDW = ", volDW,"\n",
           "   VOLUP = ", volUP, "\n") ;
    */
      ObjectsDeleteAll(1, OBJ_TREND);
      ObjectsRedraw();
      if (vol3!=0 && vol4!=0 )
      {
      ObjectCreate("Sell",OBJ_TREND,1,Time[pos4],vol4,Time[pos3],vol3);
		ObjectSet("Sell",OBJPROP_COLOR,Red);
		ObjectSet("Sell",OBJPROP_WIDTH,2);
		ObjectSet("Sell",OBJPROP_STYLE,STYLE_SOLID);
		}
		if (vol1!=0 && vol2!=0 )
		{
		ObjectCreate("Buy",OBJ_TREND,1,Time[pos2],vol2,Time[pos1],vol1);
		ObjectSet("Buy",OBJPROP_COLOR,Blue);
		ObjectSet("Buy",OBJPROP_WIDTH,2);
		ObjectSet("Buy",OBJPROP_STYLE,STYLE_SOLID);
		}

//----
   return(0);
  }
//+------------------------------------------------------------------+
Comments