DT-ZigZag-ATR
Download script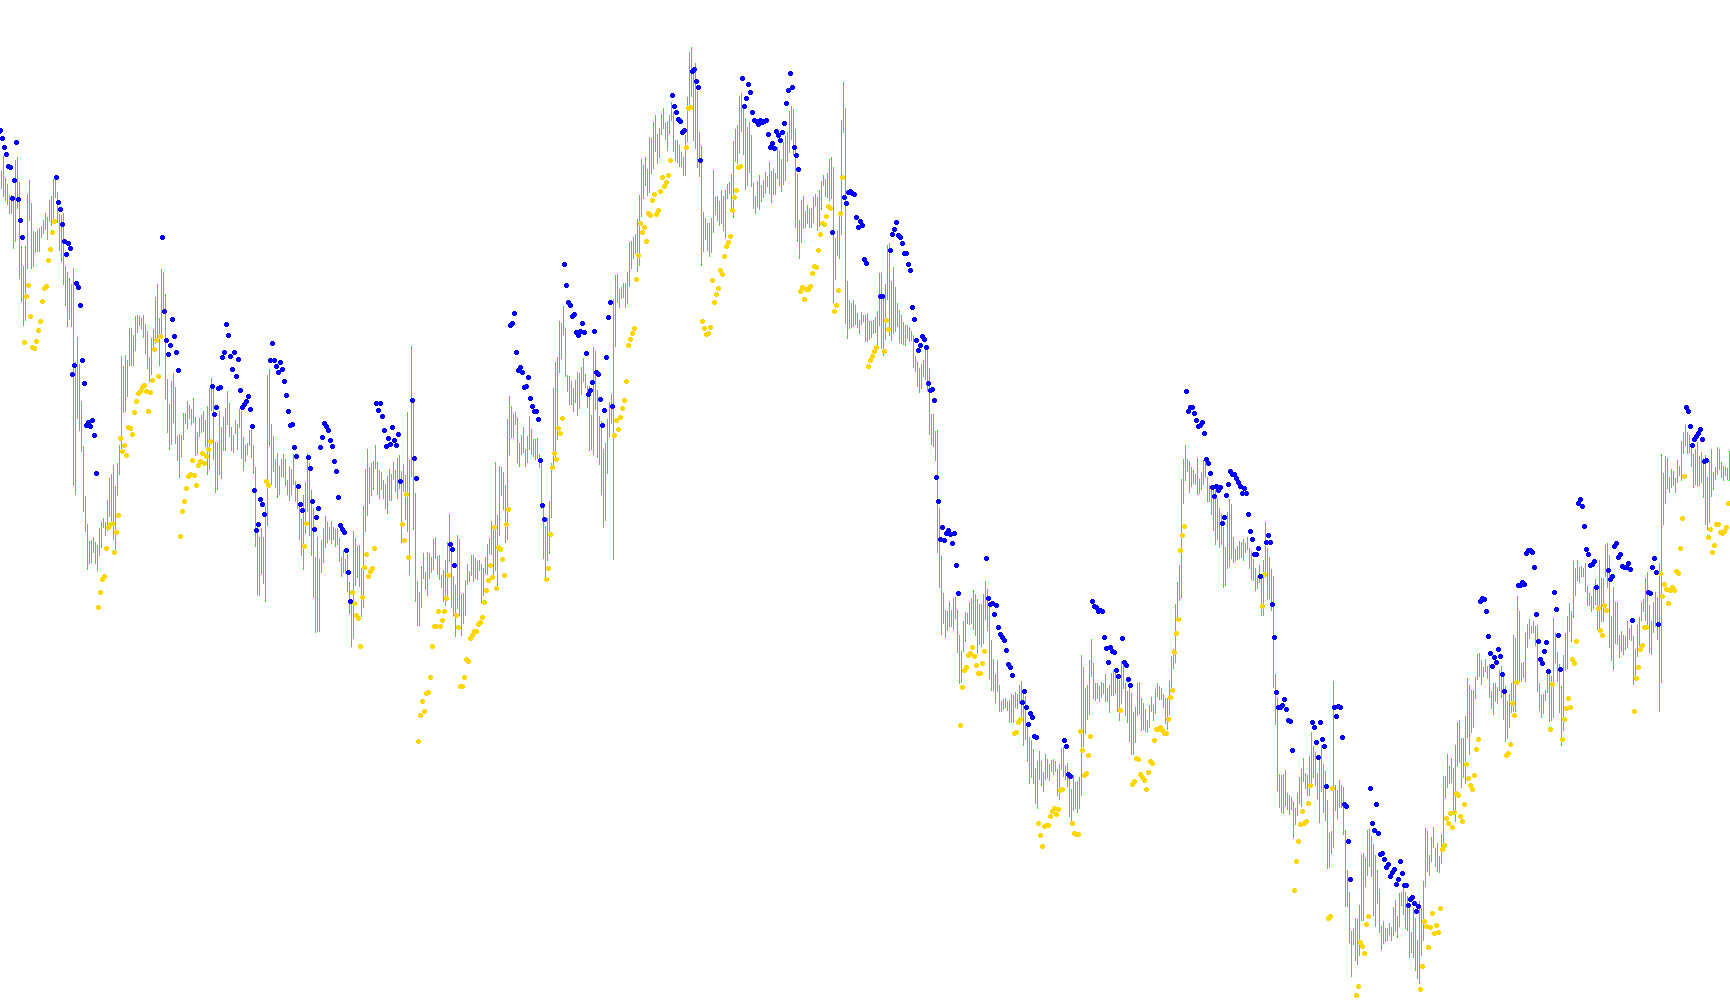
This tool is designed to provide traders with visual cues on a price chart by identifying specific price extremes and filtering them through volatility measurements. Its primary purpose is to highlight potential "turning points" in the market by combining two well-known technical concepts: the ZigZag trend analysis and the Average True Range (ATR).
How the Logic Works
The script operates by scanning historical price data to identify significant structural shifts. Here is a breakdown of the process it follows:
1. Trend Identification (ZigZag) The tool first looks for the main peaks and valleys in the market, similar to how a standard ZigZag indicator behaves. It scans the chart to find major "swing points" where the price has moved significantly enough to be considered a structural change rather than just minor noise.
2. Volatility Measurement (ATR) Simultaneously, the tool calculates the Average True Range (ATR). This represents the current "breath" or volatility of the market—essentially measuring how much the price typically moves during a specific period. This allows the script to understand whether current price movements are normal or unusually large.
3. Dynamic Signal Placement The core logic lies in how it places visual markers on your chart based on these two factors:
- Resistance Levels: When the tool detects a structural peak (the ZigZag high), it calculates a marker position slightly above that high. The distance of this marker from the peak is determined by multiplying the current volatility (ATR) by a specific factor. This creates a "buffer zone" that adapts to how volatile the market is at that moment.
- Support Levels: Conversely, when it detects a structural valley (the ZigZag low), it places a marker slightly below that low, again using the volatility-based buffer.
Summary for Traders
Instead of simply marking every price peak or valley—which can lead to "noise" in a choppy market—this script filters the data. It identifies the major trend structure and then projects markers at a distance that is mathematically proportional to the market's current movement speed.
Essentially, it helps you see where significant structural boundaries are located while ensuring those boundaries are adjusted automatically for high-volatility or low-volatility environments.
//+------------------------------------------------------------------+
//|                                                DT-ZigZag-ATR.mq4 |
//+------------------------------------------------------------------+
#property copyright "Copyright © 2005, klot"
#property link      "klot@mail.ru"

#property indicator_chart_window
#property indicator_buffers 2
#property indicator_color1 Red
#property indicator_color2 Blue
//---- input parameters
extern int       depth=12;
extern int       perATR=12;
extern double     k=2;
//---- buffers
double ExtMapBuffer1[];
double ExtMapBuffer2[];
//+------------------------------------------------------------------+
//| Custom indicator initialization function                         |
//+------------------------------------------------------------------+
int init()
  {
//---- indicators
   SetIndexStyle(0,DRAW_ARROW);
   SetIndexBuffer(0,ExtMapBuffer1);
   SetIndexArrow(0,159);
   SetIndexStyle(1,DRAW_ARROW);
   SetIndexBuffer(1,ExtMapBuffer2);
   SetIndexArrow(1,159);
//----
   return(0);
  }
//+------------------------------------------------------------------+
//| Custor indicator deinitialization function                       |
//+------------------------------------------------------------------+
int deinit()
  {
//----

//----
   return(0);
  }
//+------------------------------------------------------------------+
//| Custom indicator iteration function                              |
//+------------------------------------------------------------------+
int start()

  {
   int    limit, bigshift;
   int    counted_bars=IndicatorCounted();
   double zigzag1,atr1;
//----
  // if (counted_bars<0) return(-1);

   if (counted_bars>0) counted_bars--;

   limit=Bars-counted_bars+100;

   for (int i=limit; i>0; i--)
   {
      for (int cnt=i; cnt<(100+i); cnt++)
      {
         zigzag1=iCustom(NULL,0,"ZigZag",depth,5,3,0,cnt+1);
         if ( zigzag1!=0 ) break;
      }

   atr1=iATR(NULL,0,perATR,i);

   if (  iHigh(NULL,0,i+1)<=zigzag1  )  ExtMapBuffer2[i]=iLow(NULL,0,i)+k*atr1; else ExtMapBuffer2[i]=0.0;
   if (  iLow(NULL,0,i+1)>=zigzag1  )  ExtMapBuffer1[i]=iHigh(NULL,0,i)-k*atr1; else ExtMapBuffer1[i]=0.0;

   }
   Comment ("zigzag1 = ",zigzag1," limit = ",limit );
//----
   return(0);
  }
//+------------------------------------------------------------------+
Comments