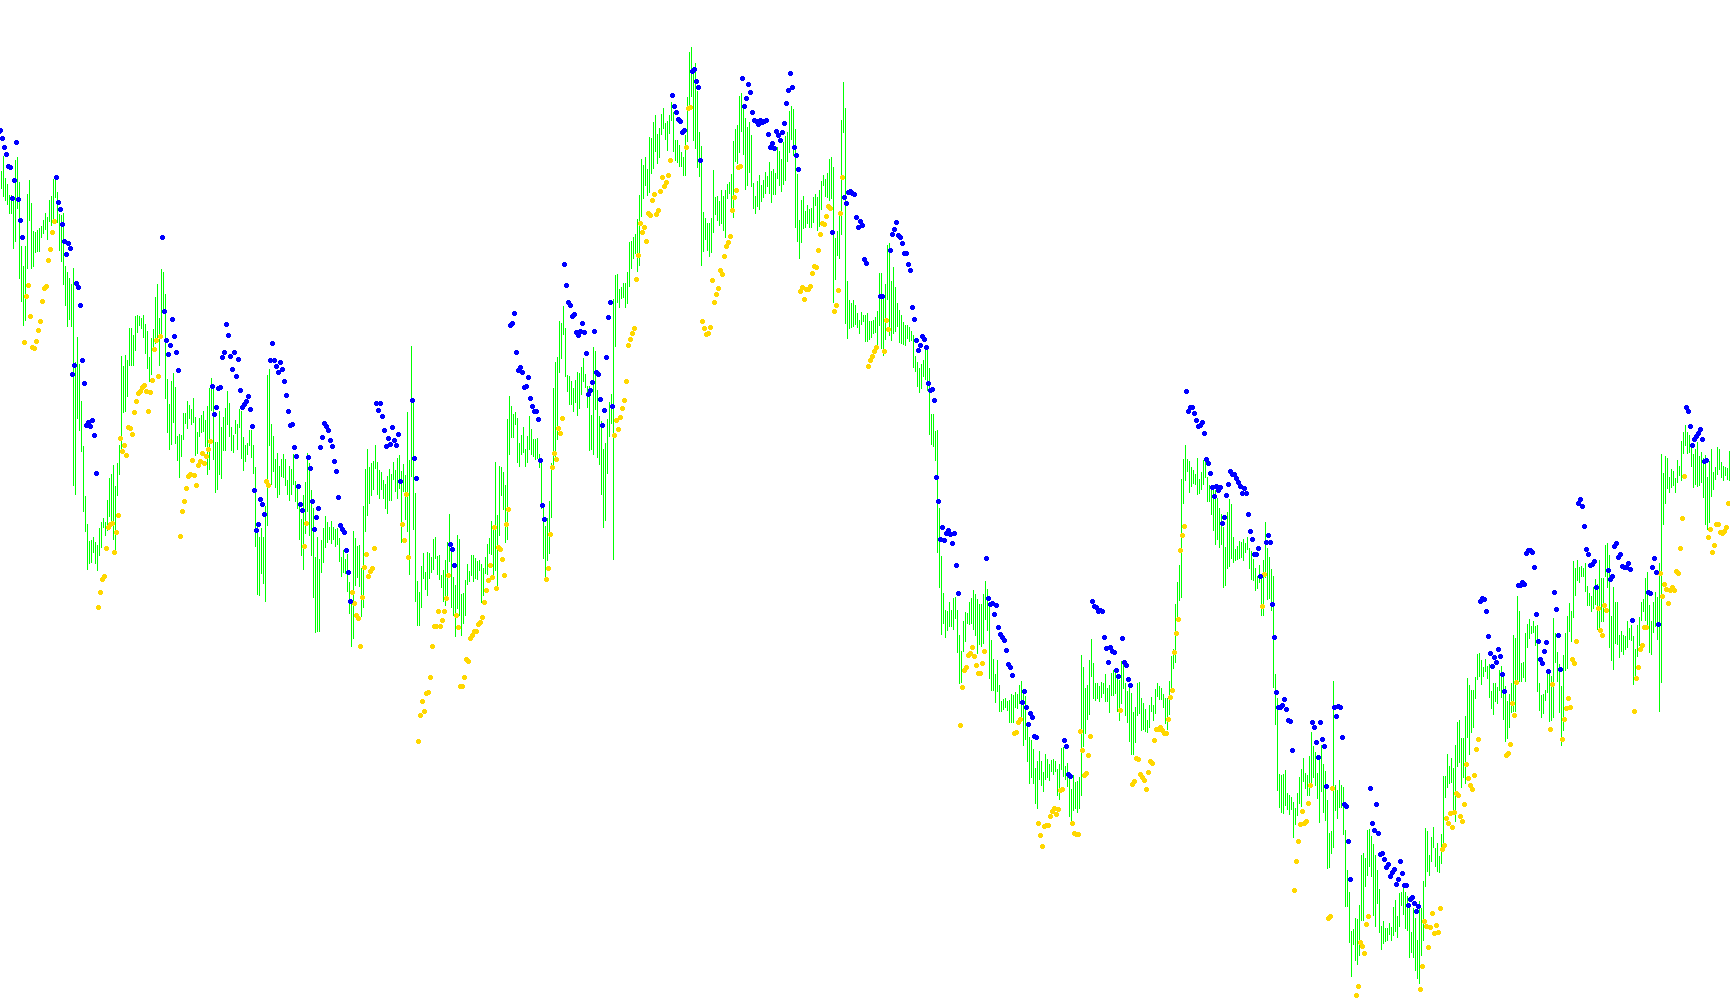
This script functions as a visual trading tool designed to identify key price levels and potential trend reversals by combining two well-known market analysis methods: the ZigZag pattern and Average True Range (ATR).
Core Functionality
The primary goal of this tool is to plot specific visual markers on your chart that represent "support" and "resistance" zones based on recent price history. It does this by scanning the market for significant peaks and troughs and then calculating a buffer around those points to help traders see where the price might react.
How the Logic Works
To provide these signals, the script follows a three-step logical process:
1. Identifying Structural Turning Points (ZigZag) The script first looks at the "ZigZag" history of the asset. The ZigZag is a standard tool used to filter out minor price noise and highlight only the major highs and lows. By using this as a foundation, the script ensures it is focusing on meaningful structural changes in the market rather than every small fluctuation.
2. Measuring Market Volatility (ATR) Simultaneously, the script calculates the Average True Range (ATR). Think of the ATR as a ruler that measures how much the price typically moves in a given period. By using this "ruler," the script ensures that its calculations adapt to the current market environment—expanding during high-volatility periods and shrinking during quieter markets.
3. Plotting Dynamic Support and Resistance Once the script knows where a major peak or trough occurred (from the ZigZag) and how much the price normally fluctuates (from the ATR), it performs a final calculation to place markers on your screen:
- For Highs: When the script detects a major peak, it places a marker slightly below that high point. It calculates this distance by multiplying the volatility (ATR) by a specific factor.
- For Lows: When the script detects a major trough, it places a marker slightly above that low point using the same logic.
Summary for the User
In simple terms, this script identifies the "skeleton" of the market trend (the peaks and valleys) and then draws markers at a precise distance away from those points based on current market volatility. This helps you visualize potential areas where price might stall or reverse, providing a cleaner view of the market structure than using either the ZigZag or the ATR indicators alone.
//+------------------------------------------------------------------+
//| DT-ZigZag-ATR.mq4                                                |
//+------------------------------------------------------------------+
#property copyright "Copyright © 2005, klot"
#property link "klot@mail.ru"
//----
#property indicator_chart_window
#property indicator_buffers 2
#property indicator_color1 Red
#property indicator_color2 Blue
//---- input parameters
extern int depth=12;
extern int perATR=12;
extern double k=2;
//---- buffers
double ExtMapBuffer1[];
double ExtMapBuffer2[];
//+------------------------------------------------------------------+
//| Custom indicator initialization function                         |
//+------------------------------------------------------------------+
int init()
  {
//---- indicators
   SetIndexStyle(0,DRAW_ARROW);
   SetIndexBuffer(0,ExtMapBuffer1);
   SetIndexArrow(0,159);
   SetIndexStyle(1,DRAW_ARROW);
   SetIndexBuffer(1,ExtMapBuffer2);
   SetIndexArrow(1,159);
//----
   return(0);
  }
//+------------------------------------------------------------------+
//| Custor indicator deinitialization function                       |
//+------------------------------------------------------------------+
int deinit()
  {
//----

//----
   return(0);
  }
//+------------------------------------------------------------------+
//| Custom indicator iteration function                              |
//+------------------------------------------------------------------+
int start()
  {
   int limit, bigshift;
   int counted_bars=IndicatorCounted();
   double zigzag1,atr1;
//----
   // if (counted_bars<0) return(-1);
   if (counted_bars>0) counted_bars--;
   limit=Bars-counted_bars+100;
   for(int i=limit; i>0; i--)
     {
      for(int cnt=i; cnt<(100+i); cnt++)
        {
         zigzag1=iCustom(NULL,0,"ZigZag",depth,5,3,0,cnt+1);
         if(zigzag1!=0)break;
        }
      atr1=iATR(NULL,0,perATR,i);
      if(iHigh(NULL,0,i+1)<=zigzag1)ExtMapBuffer2[i]=iLow(NULL,0,i)+k*atr1; else ExtMapBuffer2[i]=0.0;
      if(iLow(NULL,0,i+1)>=zigzag1)ExtMapBuffer1[i]=iHigh(NULL,0,i)-k*atr1; else ExtMapBuffer1[i]=0.0;
     }
   Comment ("zigzag1 = ",zigzag1," limit = ",limit );
//----
   return(0);
  }
//+------------------------------------------------------------------+
Comments