DT-ZigZag_v3
Download script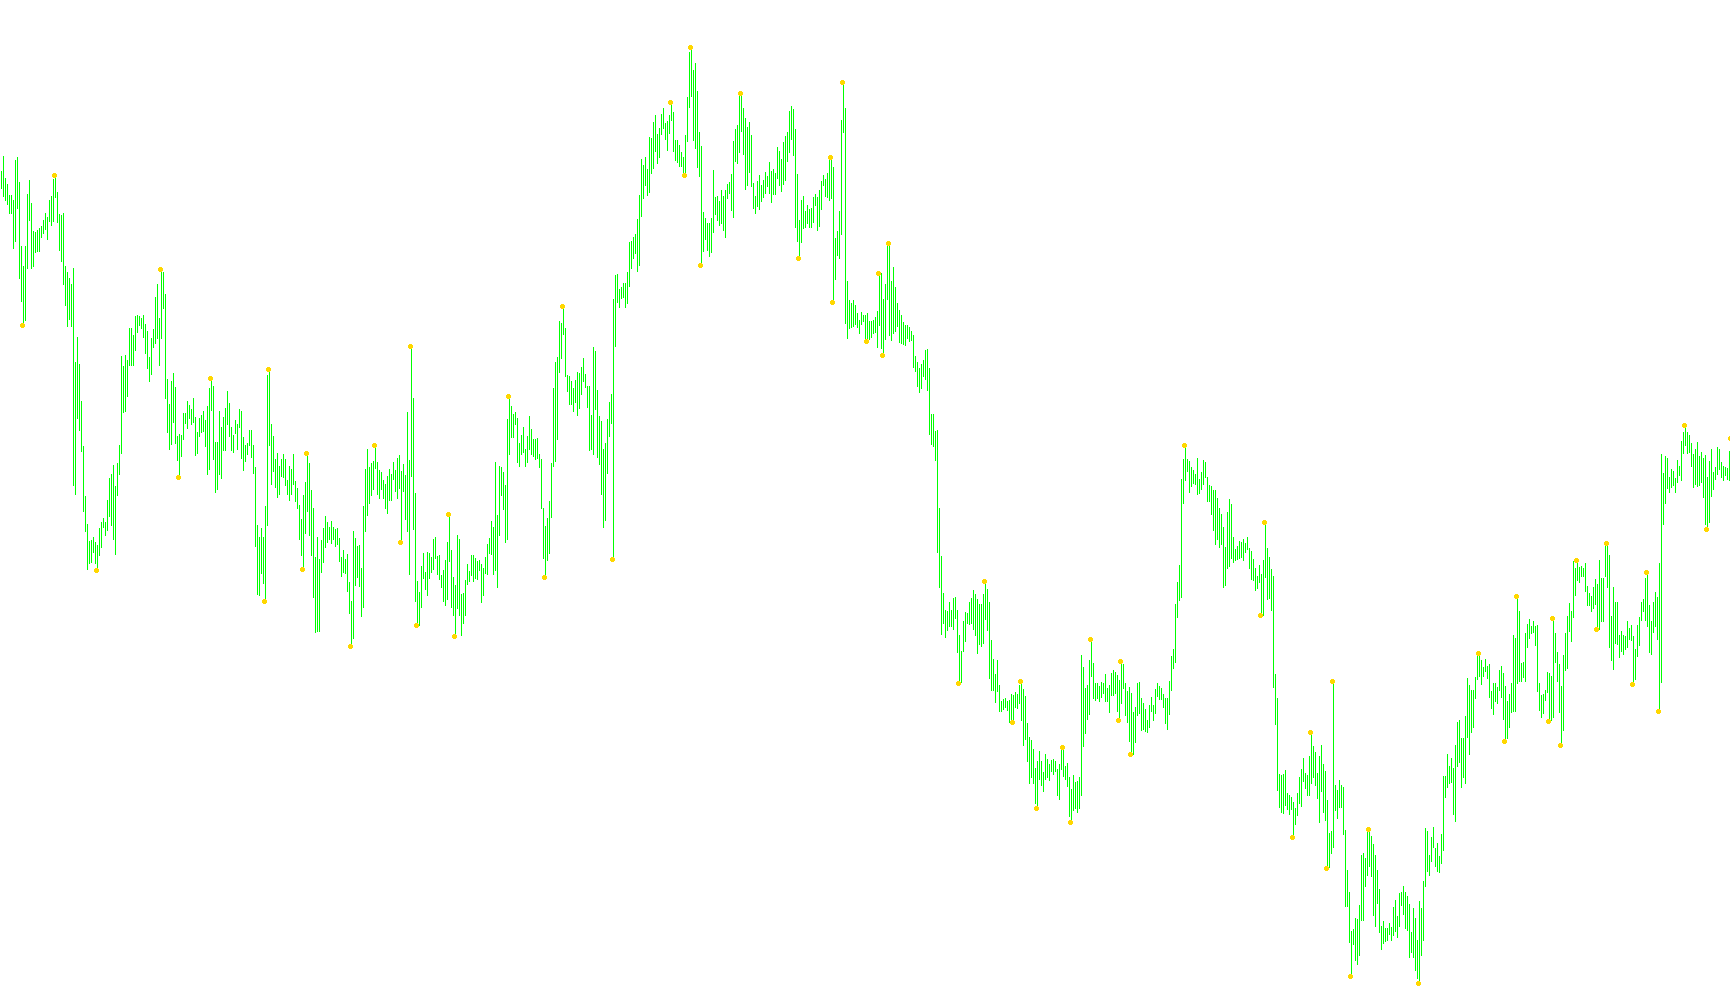
This tool is designed to enhance your trading charts by providing a more refined visual representation of price trends. It acts as a specialized overlay that identifies key market turning points—specifically the high and low peaks—while ensuring these movements are synchronized with a specific timeframe.
Core Functionality
The primary purpose of this script is to display "ZigZag" markers on your current chart. The ZigZag is a classic technical analysis tool used to filter out minor price fluctuations (market noise) and highlight significant structural changes in the market's direction. By using this script, you can more easily identify the overall trend and significant support or resistance levels.
How the Logic Works
To provide a more accurate picture than a standard ZigZag indicator, this script employs several specific logical steps:
- Timeframe Synchronization: The tool is designed to work in tandem with a broader timeframe (defined by a "Gross Period"). If your current chart is set to a timeframe larger than this period, the script will notify you, as it requires a smaller timeframe context to perform its calculations correctly.
- Smart Data Mapping: Instead of simply drawing the ZigZag on your current screen, the script looks "ahead" into a higher-level timeframe. It automatically calculates where the price sits in relation to that larger timeframe's history.
- Dynamic Shift Calculation: The logic includes a specialized search mechanism. It compares the time of each candle on your current chart against the data from the larger period. It then "shifts" the data accordingly so that the ZigZag lines you see align perfectly with the major movements of the higher timeframe.
- Visual Filtering: Through adjustable settings (Depth, Deviation, and Backstep), the script determines how much price movement is necessary to trigger a new point. This allows users to choose between seeing every small move or only the most significant market swings.
Summary for the Trader
In simple terms, this script takes the "big picture" of a larger timeframe and projects it onto your smaller, more active trading chart. It allows you to see the significant structural peaks and valleys of a major trend while you are performing your detailed analysis on a much faster speed, ensuring you stay aligned with the broader market direction.
//+------------------------------------------------------------------+
//|                                                    DT-ZigZag.mq4 |
//+------------------------------------------------------------------+
#property copyright "klot"
#property link      "klot@mail.ru"
//----
#property indicator_chart_window
#property indicator_buffers 1
#property indicator_color1 Red
//---- input parameters
extern int GrossPeriod=60;
extern int ExtDepth=12;
extern int ExtDeviation=5;
extern int ExtBackstep=3;
//---- buffers
double ExtMapBuffer1[];
datetime daytimes[];
//+------------------------------------------------------------------+
//| Custom indicator initialization function                         |
//+------------------------------------------------------------------+
int init()
  {
//---- indicators
   SetIndexStyle(0,DRAW_ARROW);
   SetIndexArrow(0,159);
   SetIndexBuffer(0,ExtMapBuffer1);
   SetIndexEmptyValue(0,0.0);
//----
   if (Period()>GrossPeriod) { Alert("DT-ZigZag: Òåêóùèé òàéìôðåéì äîëæåí áûòü ìåíüøå ÷åì ", GrossPeriod); return(0); }
   // Âñå Time[] ñåðèè âðåìåíè îòñîðòèðîâàíî â íàïðàâëåíèè óáûâàíèÿ
   ArrayCopySeries(daytimes,MODE_TIME,Symbol(),GrossPeriod);
   return(0);
  }
//+------------------------------------------------------------------+
//| Custor indicator deinitialization function                       |
//+------------------------------------------------------------------+
int deinit()
  {
//----
//----
   return(0);
  }
//+------------------------------------------------------------------+
//| Custom indicator iteration function                              |
//+------------------------------------------------------------------+
int start()
  {
   int    limit, bigshift;
   int    counted_bars=IndicatorCounted();
//----
   if (counted_bars<0) return(-1);
   if (counted_bars>0) counted_bars--;
//----
   limit=Bars-counted_bars;
//----
   for(int i=0; i<limit; i++)
     {
      if(Time[i]>=daytimes[0]) bigshift=0;
      else
        {
         bigshift=ArrayBsearch(daytimes,Time[i-1],WHOLE_ARRAY,0,MODE_DESCEND);
         if(Period()<=GrossPeriod) bigshift++;
        }
      ExtMapBuffer1[i]=iCustom(NULL,GrossPeriod,"ZigZag",ExtDepth,ExtDeviation,ExtBackstep,0,bigshift);
     }
//----
   return(0);
  }
//+------------------------------------------------------------------+
Comments