DT-ZigZag
Download script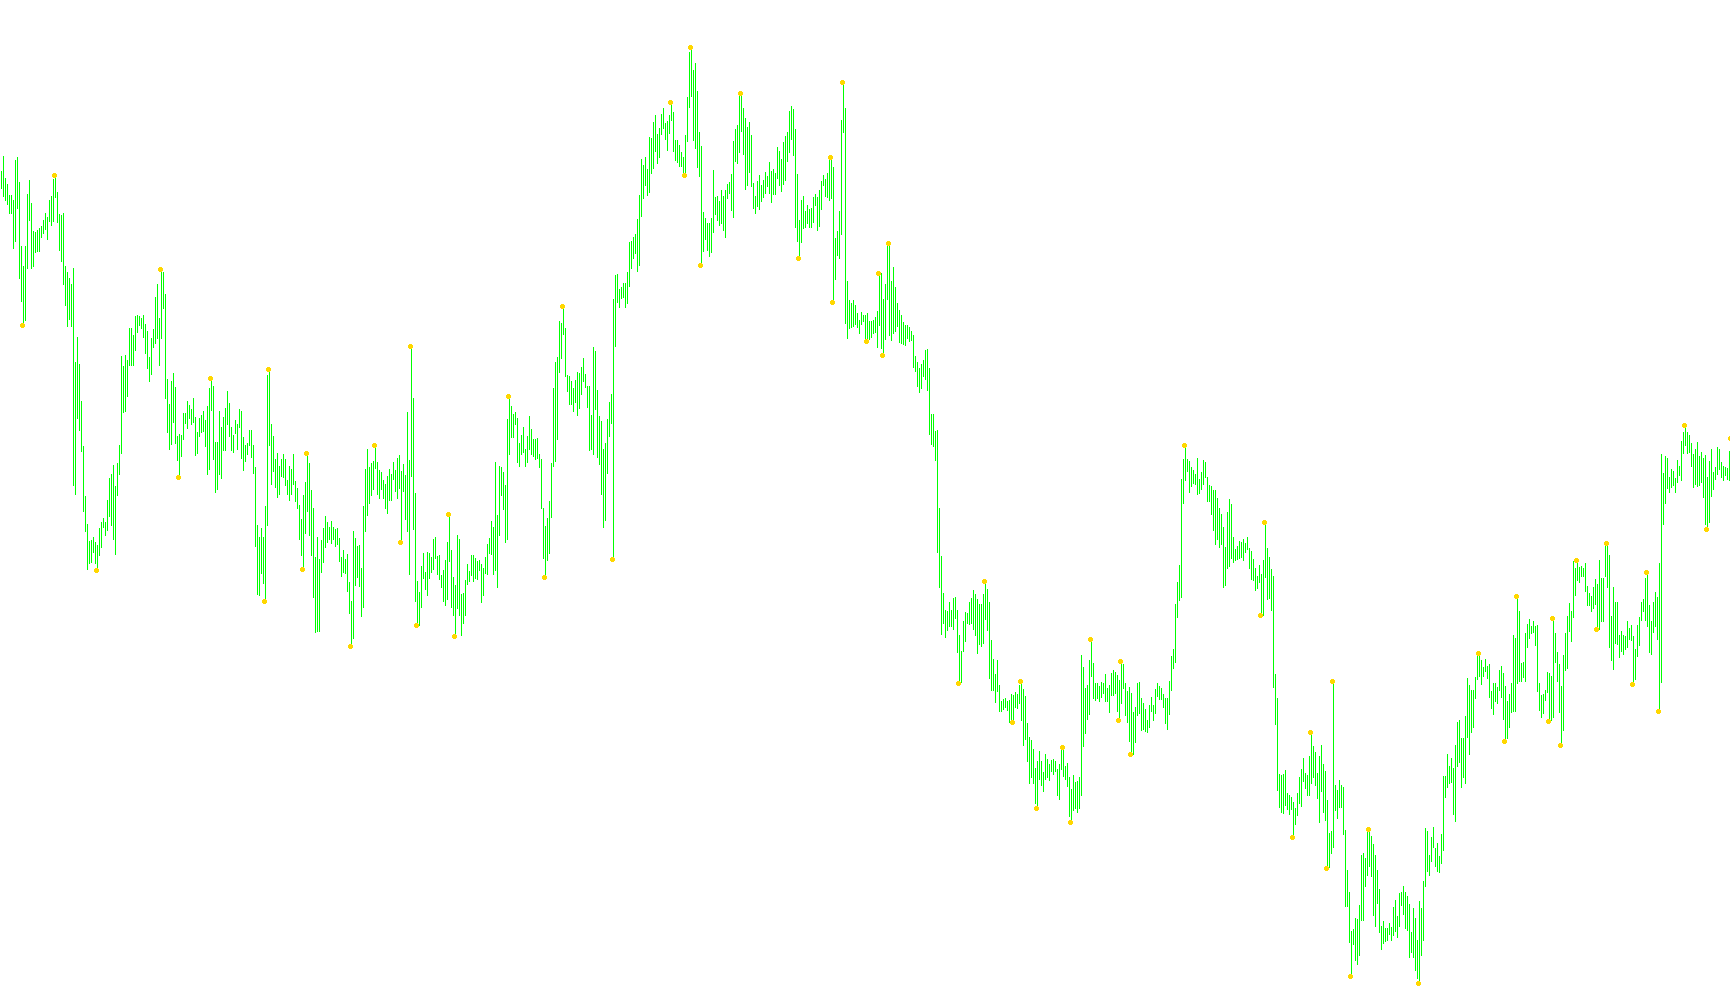
This script is designed to enhance your trading charts by providing a more sophisticated view of market trends. It acts as an overlay that identifies significant price swings, helping traders visualize the underlying "skeleton" of the market's movement.
Core Functionality
The primary purpose of this tool is to sync data across different timeframes. While standard indicators often struggle to show clear patterns when you switch from a small timeframe (like 1-minute charts) to a larger one (like hourly charts), this script bridges that gap. It pulls structural data from a higher time interval and maps it onto your current view, ensuring that the "big picture" trends remain visible regardless of which specific timeframe you are focusing on.
How the Logic Works
The script operates using three main logical steps:
1. Multi-Timeframe Synchronization
The tool begins by looking at a "Gross Period"—a larger time window defined by the user. It identifies the major price movements occurring on that larger scale and calculates how those movements relate to the current smaller timeframe you are viewing. This ensures that the visual information is consistent and mathematically aligned between different views.
2. Dynamic Time Mapping
To make sure the data lines up perfectly, the script performs a real-time search for specific timestamps. It compares the current candle's time against the historical data of the larger timeframe. By identifying exactly where a "big" price move started or ended in the past, it can accurately place those markers on your current chart without causing visual errors or misalignment.
3. Trend Visualization (ZigZag Integration)
At its heart, the script utilizes the "ZigZag" logic, which ignores minor market noise and small fluctuations. Instead, it waits for significant price deviations to occur. Once a meaningful move is detected on the higher timeframe, the script draws a specific marker (an arrow) on your chart. This allows you to see high-level support and resistance points that might otherwise be hidden by the "noise" of lower-timeframe trading.
Practical Benefit
By using this logic, you are essentially looking at a "filtered" version of the market. It removes the distractions of small price movements and highlights the significant structural turns. This helps in identifying where the market is truly heading, making it easier to spot major trend reversals and long-term price structures that are relevant for higher-level analysis.
//+------------------------------------------------------------------+
//|                                                    DT-ZigZag.mq4 |
//+------------------------------------------------------------------+
#property copyright "klot"
#property link      "klot@mail.ru"

#property indicator_chart_window
#property indicator_buffers 1
#property indicator_color1 Yellow
//---- input parameters
extern int GrossPeriod=60;
extern int ExtDepth=12;
extern int ExtDeviation=5;
extern int ExtBackstep=3;
//---- buffers
double ExtMapBuffer1[];
datetime daytimes[];
//+------------------------------------------------------------------+
//| Custom indicator initialization function                         |
//+------------------------------------------------------------------+
int init()
  {
//---- indicators
   SetIndexStyle(0,DRAW_ARROW);
   SetIndexArrow(0,159);
   SetIndexBuffer(0,ExtMapBuffer1);
   SetIndexEmptyValue(0,0.0);
//----
   if (Period()>GrossPeriod) { Alert("DT-ZigZag: Òåêóùèé òàéìôðåéì äîëæåí áûòü ìåíüøå ÷åì ", GrossPeriod); return(0); }
   // Âñå Time[] ñåðèè âðåìåíè îòñîðòèðîâàíî â íàïðàâëåíèè óáûâàíèÿ
   ArrayCopySeries(daytimes,MODE_TIME,Symbol(),GrossPeriod);
   return(0);
  }
//+------------------------------------------------------------------+
//| Custor indicator deinitialization function                       |
//+------------------------------------------------------------------+
int deinit()
  {
//----

//----
   return(0);
  }
//+------------------------------------------------------------------+
//| Custom indicator iteration function                              |
//+------------------------------------------------------------------+
int start()
  {
   int    limit, bigshift;
   int    counted_bars=IndicatorCounted();
//----
   if (counted_bars<0) return(-1);

   if (counted_bars>0) counted_bars--;

   limit=Bars-counted_bars;

   for (int i=0; i<limit; i++)
   {
   if(Time[i]>=daytimes[0]) bigshift=0;
   else
     {
      bigshift = ArrayBsearch(daytimes,Time[i-1],WHOLE_ARRAY,0,MODE_DESCEND);
      if(Period()<=GrossPeriod) bigshift++;
     }
  ExtMapBuffer1[i]=iCustom(NULL,GrossPeriod,"ZigZag",ExtDepth,ExtDeviation,ExtBackstep,0,bigshift);
   }
//----
   return(0);
  }
//+------------------------------------------------------------------+
Comments