DynamicRS_C
Download script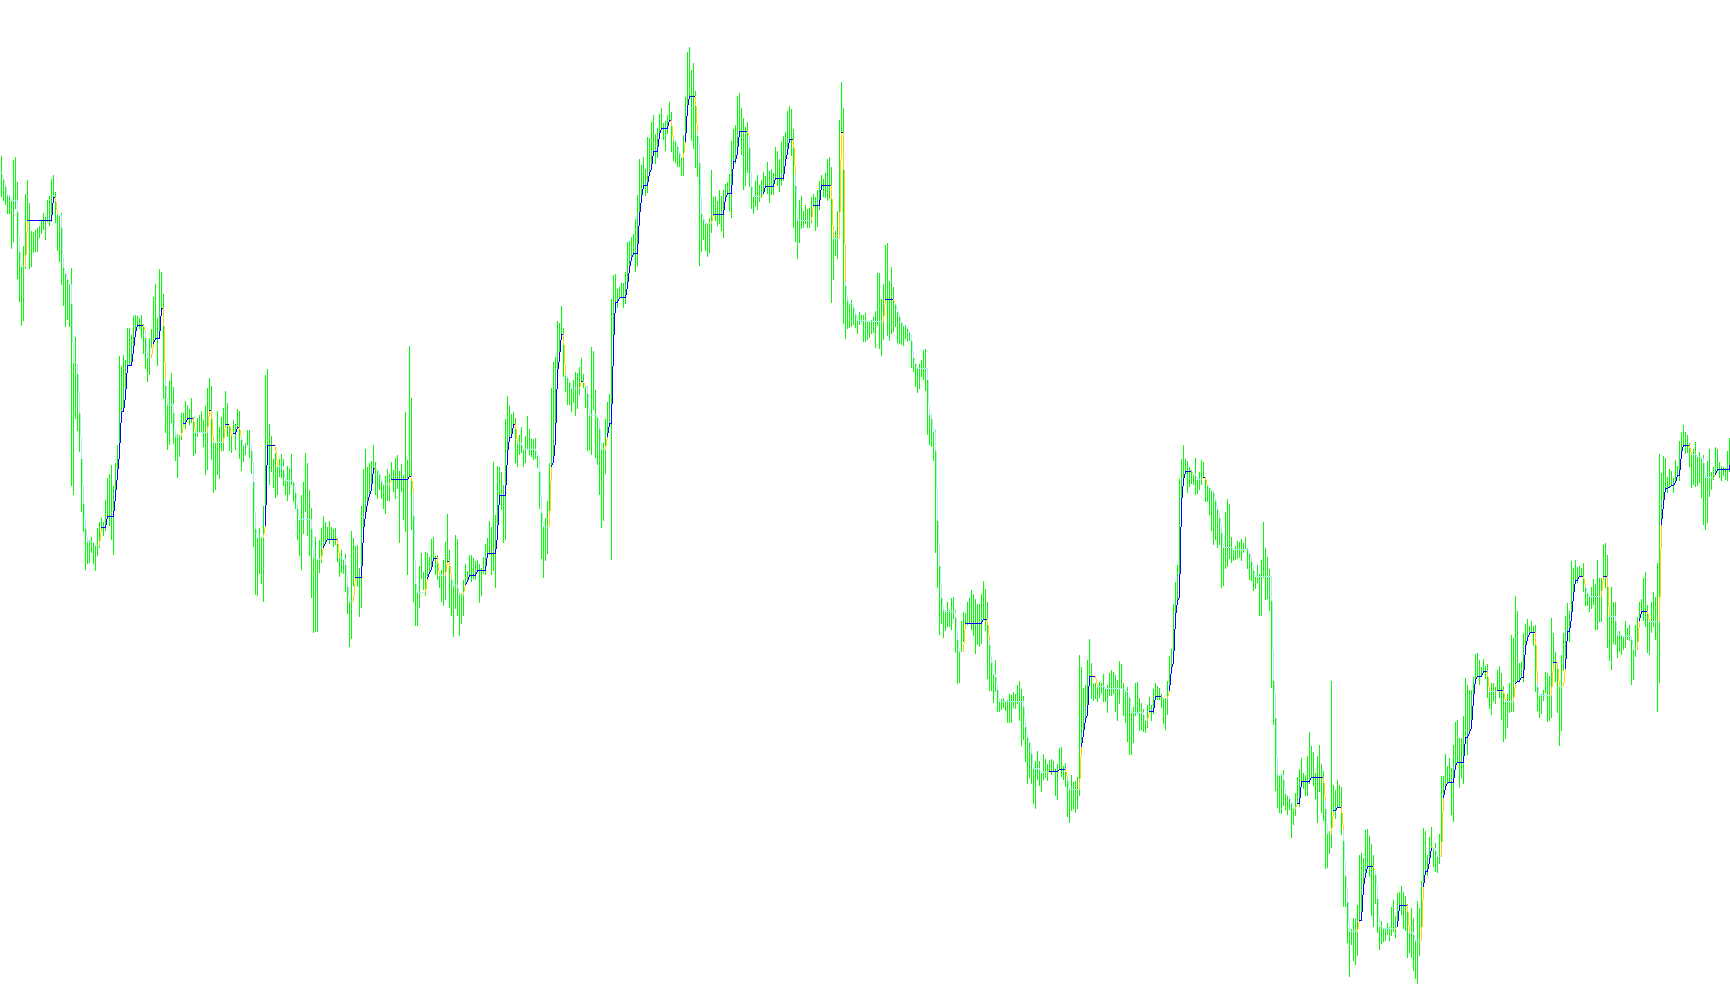
This tool is designed to provide traders with a visual map of market momentum by identifying and highlighting structural shifts in price action. It works by tracking the extremes of price movements—specifically the highest highs and lowest lows—over a customizable period to determine whether the market is trending upward, downward, or currently in a state of transition.
How the Logic Works
The script constantly monitors the "peaks" and "valleys" of the market. It evaluates recent price data against historical levels to decide which direction the current momentum is favoring. Here is how it categorizes market behavior:
- Upward Momentum (Aqua): When the market establishes a new "floor" by consistently creating higher lows compared to previous periods, the script identifies this as an upward trend and marks it accordingly.
- Downward Momentum (Red): Conversely, when the price begins to consistently hit new "ceilings" that are lower than previous ones, the script recognizes this as a downward trend.
- Trend Transition (Yellow): The script features a specific alert system for when the market is neither making clear progress up nor down. When the price fails to establish a new high or low relative to its recent history, the indicator switches to a transitionary state. This serves as a warning that the previous trend may be losing steam or reversing.
Visual Interpretation for Traders
The tool simplifies complex price fluctuations into three distinct visual cues:
- Aqua Lines signal a healthy bullish environment where the market is finding support at increasingly higher levels.
- Red Lines indicate a bearish environment where the market is succumbing to lower lows.
- Yellow Lines represent a "neutral" or "warning" zone. These appear when the price action becomes choppy or breaks its established pattern, suggesting that a change in trend may be imminent.
Key Usage Note
To ensure the highest level of accuracy, the logic is designed to confirm movements based on completed price action. Traders are advised to wait for a candle to close after a yellow transition line appears before making definitive decisions on the new trend direction. This provides a buffer against "fake-outs" and ensures that the momentum shift is confirmed by the market's closing price.
//+------------------------------------------------------------------+
//|                                                  DynamicRS_C.mq4 |
//|                                 Copyright © 2007, Nick A. Zhilin |
//|                                                  rebus58@mail.ru |
//+------------------------------------------------------------------+
// Yellow   - may be change of trend
// Red      - down trend
// Aqua     - up trend
// Please wait bar closing after yellow indicator's line!
//+------------------------------------------------------------------+

#property copyright "Copyright © 2007, Nick A. Zhilin"
#property link      "rebus58@mail.ru"

extern int IPeriod=5;

#property indicator_chart_window
#property indicator_buffers 3
#property indicator_color1 Yellow
#property indicator_color2 Aqua
#property indicator_color3 Red

//---- buffers
double ExtMapBuffer1[];
double ExtMapBuffer2[];
double ExtMapBuffer3[];

//+------------------------------------------------------------------+
//| Custom indicator initialization function                         |
//+------------------------------------------------------------------+
int init()
  {
   IndicatorShortName("DynamicRS_C");
//---- indicators
   SetIndexStyle(0,DRAW_LINE);
   SetIndexBuffer(0,ExtMapBuffer1);
   SetIndexStyle(1,DRAW_LINE);
   SetIndexBuffer(1,ExtMapBuffer2);
   SetIndexStyle(2,DRAW_LINE);
   SetIndexBuffer(2,ExtMapBuffer3);

//----
   return(0);
  }
//+------------------------------------------------------------------+
//| DynamicRS                                                        |
//+------------------------------------------------------------------+
int start()
  {
   int i,counted_bars=IndicatorCounted();

//----
   i=Bars-counted_bars-1;
   while(i>=0)
     {
      if(High[i]<High[i+1] && High[i]<High[i+IPeriod] && High[i]<ExtMapBuffer1[i+1])
         {
          ExtMapBuffer1[i]=High[i];
          ExtMapBuffer3[i]=High[i];
         }
      else if(Low[i]>Low[i+1] && Low[i]>Low[i+IPeriod] && Low[i]>ExtMapBuffer1[i+1])
         {
          ExtMapBuffer1[i]=Low[i];
          ExtMapBuffer2[i]=Low[i];
         }
      else
         {
          ExtMapBuffer1[i]=ExtMapBuffer1[i+1];
          if(ExtMapBuffer1[i+1]==ExtMapBuffer2[i+1])
             ExtMapBuffer2[i]=ExtMapBuffer1[i+1];
          else if(ExtMapBuffer1[i+1]==ExtMapBuffer3[i+1])
             ExtMapBuffer3[i]=ExtMapBuffer1[i+1];
         }
      i--;
     }


//----
   return(0);
  }
//+------------------------------------------------------------------+
Comments