PowerTrend
Download script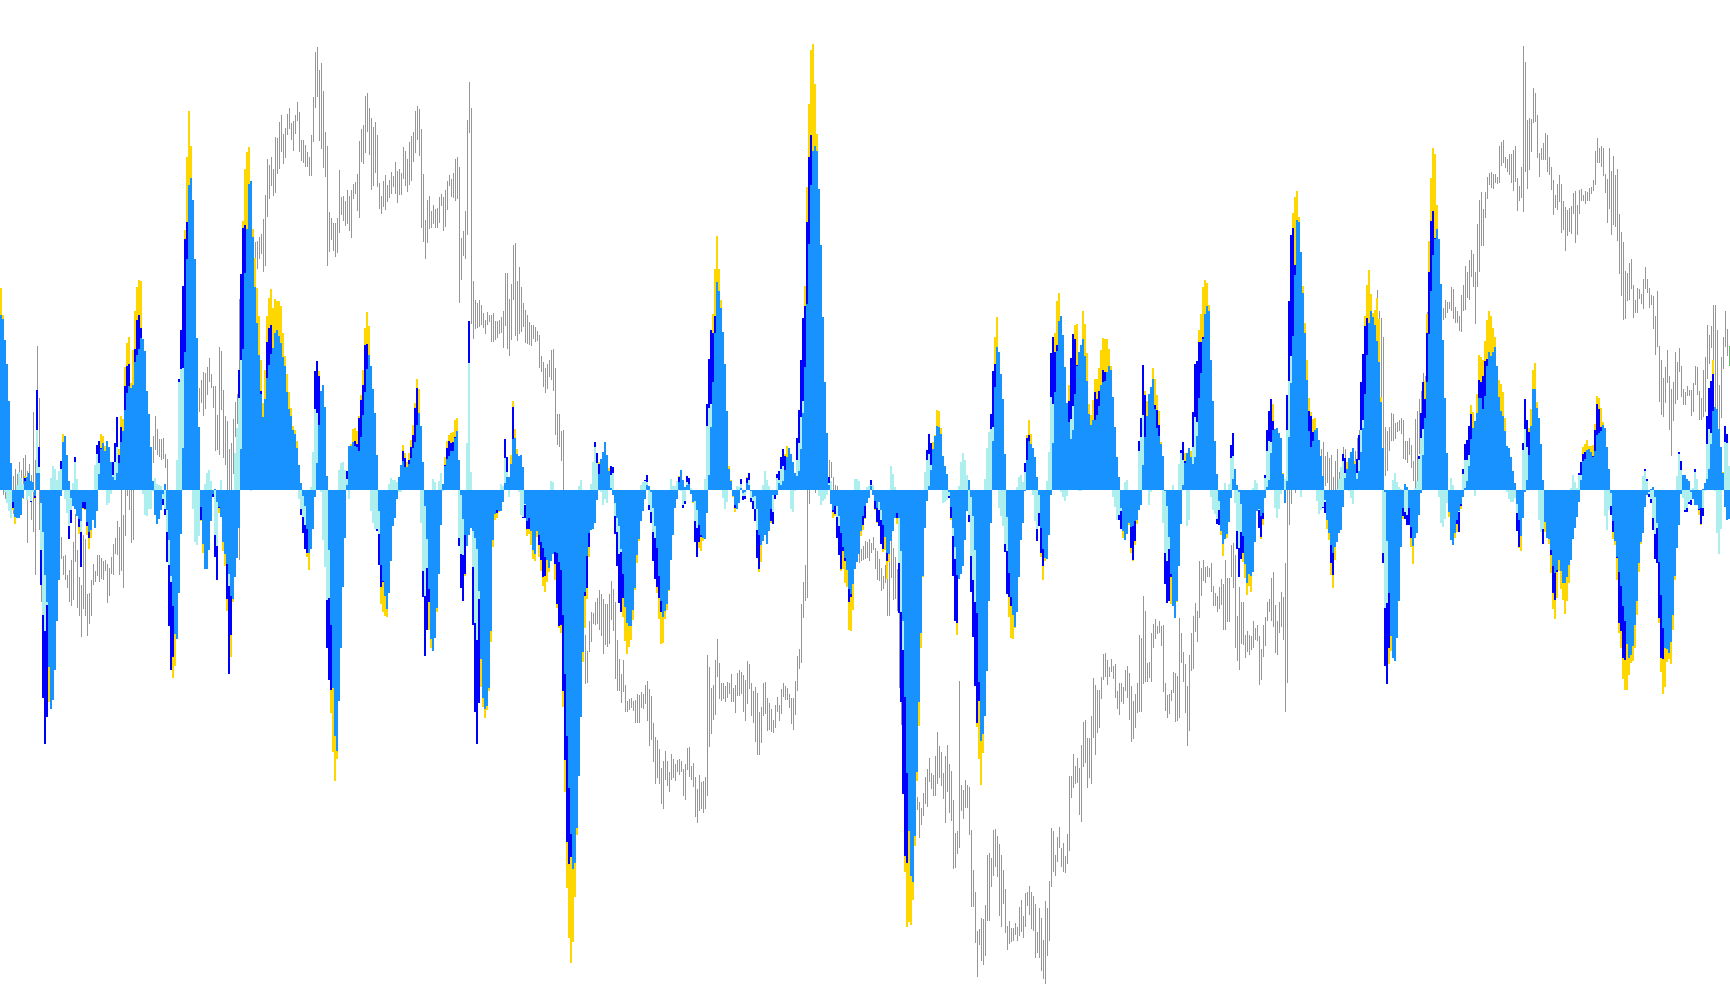
This technical indicator is designed to provide traders with a visual representation of market momentum and price dynamics through a custom histogram. It operates in a separate window, allowing users to observe specific mathematical deviations rather than the direct price action of the main chart.
Core Logic and Mechanism
The script functions by analyzing the relationship between different moving averages based on the user's defined periods. Instead of simply plotting a single average, it performs a multi-layered calculation to identify "weighted" differences in price movement:
- Dynamic Weighting: The tool calculates a cumulative sum of weighted moving averages over a specific range. This allows the indicator to sense the "velocity" of price changes rather than just the current value.
- Comparative Analysis: By comparing these weighted sums against standard moving averages at different intervals, the script identifies discrepancies between short-term and long-term trends.
- Momentum Extraction: The logic derives several distinct values (represented by different colors/buffers) based on these discrepancies. These values represent specific components of market pressure—essentially "filtering" the noise of the market to show underlying strength or weakness.
Visual Output
The indicator translates these complex mathematical differences into a four-part histogram:
- Trend Components: The script identifies specific thresholds where price deviations are positive or negative.
- Directional Signaling: Depending on whether the calculated values fall above or below zero, the indicator populates different buffers. This helps traders distinguish between different types of momentum—such as accelerating trends versus decelerating ones.
- Visual Differentiation: The use of four separate buffers ensures that different layers of market data are distinguishable, providing a multi-dimensional view of the current market environment in a single visual field.
Summary for the User
In essence, this tool acts as a "momentum detector." It looks at how fast and how heavily the price is moving relative to its historical average. By visualizing these variances as a histogram, it helps traders see where the market is gaining strength or losing steam, providing a clearer picture of market sentiment than a standard trend line alone.
//+------------------------------------------------------------------+
//|                                                        Volna.mq4 |
//|                                           Copyright © 2007, SVS. |
//|                                                                  |
//+------------------------------------------------------------------+
#property copyright "Copyright © 2007, SVS."
#property link      ""

#property indicator_separate_window
#property indicator_buffers 4
#property indicator_color1 MediumSeaGreen
#property indicator_color2 Blue
#property indicator_color3 Red
#property indicator_color4 Black
extern int PT_chart=6;
extern int PT_Period=1;
//---- buffers
double ExtMapBuffer1[];
double ExtMapBuffer2[];
double ExtMapBuffer3[];
double ExtMapBuffer4[];
//+------------------------------------------------------------------+
//| Custom indicator initialization function                         |
//+------------------------------------------------------------------+
int init()
  {
//---- indicators
   SetIndexStyle(0,DRAW_HISTOGRAM,0,2);
   SetIndexBuffer(0,ExtMapBuffer1);
   SetIndexStyle(1,DRAW_HISTOGRAM,0,2);
   SetIndexBuffer(1,ExtMapBuffer2);
   SetIndexStyle(2,DRAW_HISTOGRAM,0,2);
   SetIndexBuffer(2,ExtMapBuffer3);
   SetIndexStyle(3,DRAW_HISTOGRAM,0,2);
   SetIndexBuffer(3,ExtMapBuffer4);
   IndicatorShortName("PT("+PT_Period+")");
   SetIndexLabel(0,"PT");
//----
   return(0);
  }
//+------------------------------------------------------------------+
//| Custom indicator deinitialization function                       |
//+------------------------------------------------------------------+
int deinit()
  {
//----

//----
   return(0);
  }
//+------------------------------------------------------------------+
//| Custom indicator iteration function                              |
//+------------------------------------------------------------------+
int start()
  {
   double vm,vt,vt0,vt1;
   double vj,vj0,vj1,vk,vk0,vk1;
   double vs0,vs1,vd0,vd1;
   double vts=0;
   int MODE,p,p0,p1,p2;
//---- TODO: add your code here
   //int counted_bars=IndicatorCounted();
   //for(int i=Bars;i>=0;i--){
   int limit;
   int counted_bars=IndicatorCounted();
   if(counted_bars>0) counted_bars--;
   limit=Bars-counted_bars-1;
   for(int i=0;i<=limit;i++){
//------------------------------------------------------
      MODE=0;
      p1=PT_chart*PT_Period;
      p2=p1*2;
      p0=p2/p1;
      vts=0;
      for (int c=0;c<=p2;c++){
         vts=vts+iMA(NULL,0,c,0,MODE,PRICE_WEIGHTED,i);
         if(c==p0)vt=(vts/p0)-iMA(NULL,0,p0,0,MODE,PRICE_WEIGHTED,i);
         if(c==p1)vt0=(vts/p1)-iMA(NULL,0,p1,0,MODE,PRICE_WEIGHTED,i);
         if(c==p2)vt1=(vts/p2)-iMA(NULL,0,p2,0,MODE,PRICE_WEIGHTED,i);
         }
//---------------------------------------------------------
      //--------------------------------
      vk1=(vt0+vt1)/2;
      vd1=(vt0/2);
      vj1=(vt1-vd1);
      //-----------------------------
      ExtMapBuffer4[i]=vj1;
      if(vd1<0)ExtMapBuffer3[i]=vd1;
      if(vt1<0)ExtMapBuffer1[i]=vt1;
      if(vk1<0)ExtMapBuffer2[i]=vk1;
      if(vd1>0)ExtMapBuffer3[i]=vd1;
      if(vt1>0)ExtMapBuffer1[i]=vt1;
      if(vk1>0)ExtMapBuffer2[i]=vk1;
   }
//----
   return(0);
  }
//+------------------------------------------------------------------+
Comments