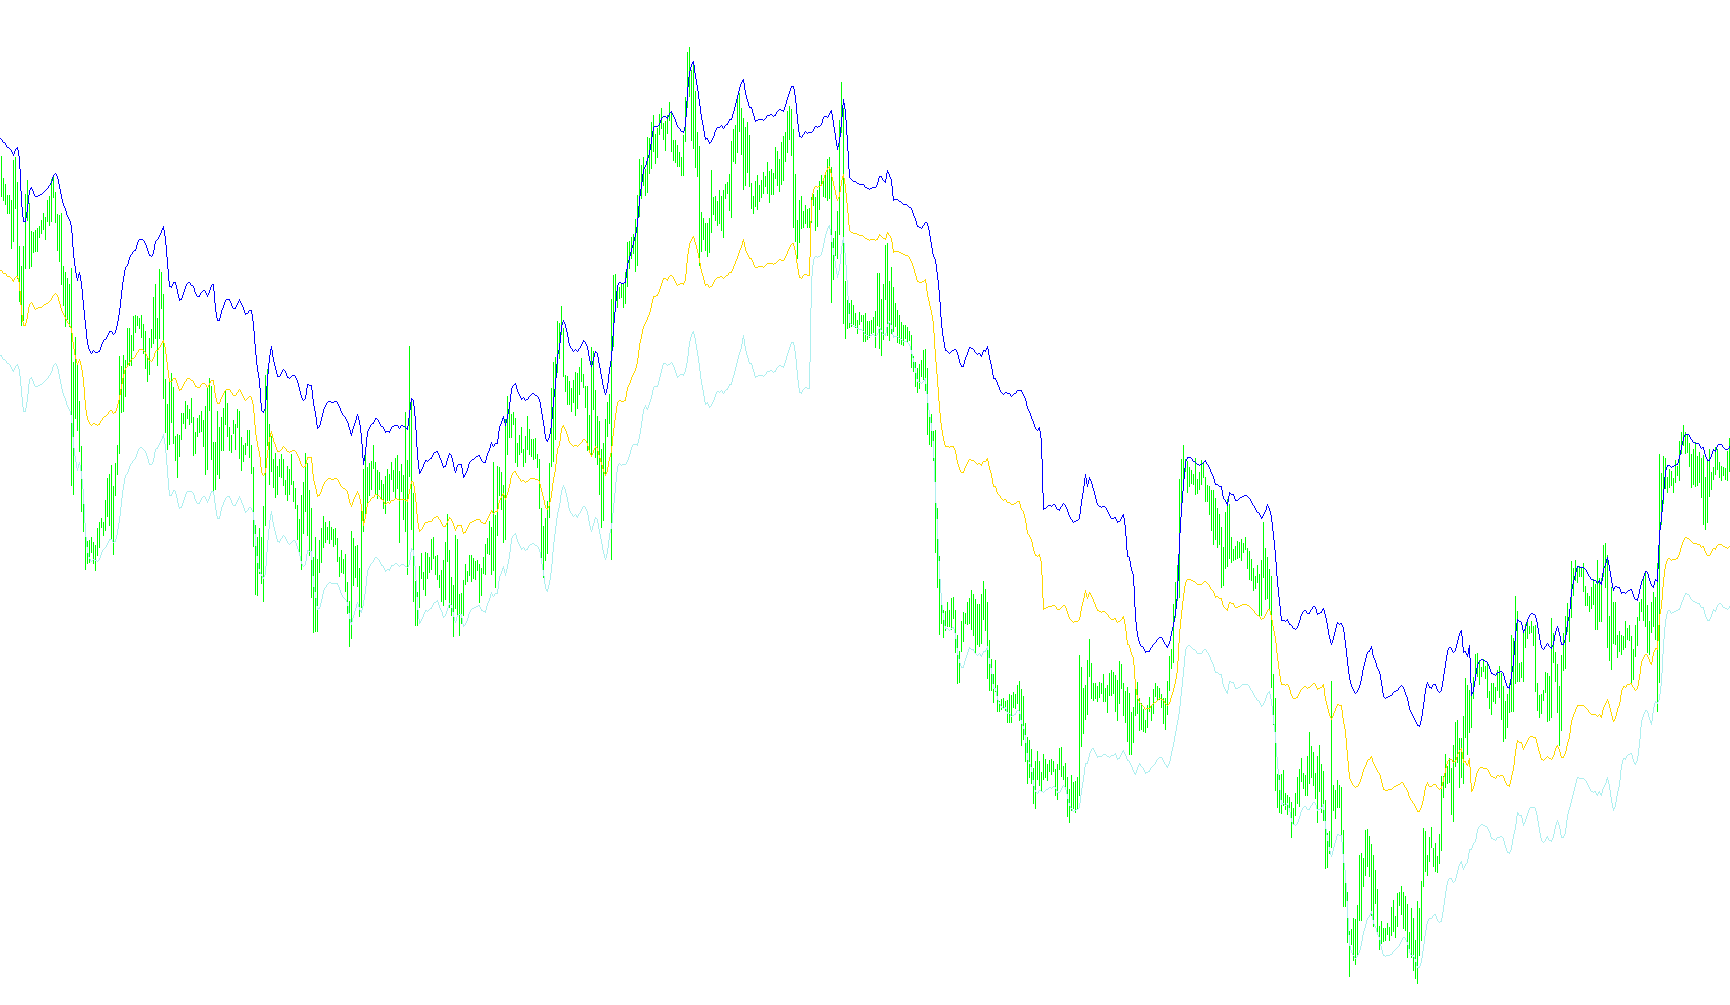
This script is designed as a visual trading tool for MetaTrader 4 that identifies key price levels on a chart. Its primary purpose is to calculate three distinct moving lines that help traders visualize potential areas of support and resistance based on recent historical price action.
How the Logic Works
The script analyzes the market by looking at a specific window of time (defined by the period setting). Instead of just looking at the current price, it evaluates the "extremes" and the "average" of that timeframe to determine where the price is likely to react.
The logic breaks down into three main components:
1. The Pivot Point To establish a baseline, the script identifies the highest price reached and the lowest price reached over the chosen period. It then calculates an average of the closing prices from the immediate past. By combining these three elements—the high, the low, and the three-point close average—it creates a "Pivot" line. This represents the central balance point of the current market trend.
2. High-Level Boundaries (HL1 and HL2) Once the central Pivot is established, the script calculates two secondary lines that act as boundaries:
- Upper Boundary (HL1): This calculation takes the relationship between the Pivot and the historical low to project a potential upper ceiling for the price. It helps identify where upward momentum might face resistance.
- Lower Boundary (HL2): Similarly, this takes the relationship between the Pivot and the historical high to project a potential lower floor. It helps identify where downward momentum might find support.
Visual Representation on Your Chart
The script renders these calculations as three separate lines:
- The Pivot: The primary center line showing the current equilibrium.
- HL1 & HL2: Two flanking lines that expand outward from the pivot, creating a visual "channel" or zone of activity.
By watching how these lines move and interact with the live price, traders can get a clearer sense of the market's structure, identifying zones where the price might stall, reverse, or continue its trend based on historical extremes.
//+------------------------------------------------------------------+
//|                                                DynFloatPivot.mq4 |
//|                                 Copyright © 2006, Nick A. Zhilin |
//|                                              rebus@dialup.etr.ru |
//+------------------------------------------------------------------+
#property copyright "Copyright © 2006, Nick A. Zhilin"
#property link      "rebus@dialup.etr.ru"
//----
extern int IPeriod = 100;
//----
#property indicator_chart_window
#property indicator_buffers 3
#property indicator_color1 Yellow
#property indicator_color2 Red
#property indicator_color3 Aqua
//---- buffers
double ExtMapBuffer1[];
double ExtMapBuffer2[];
double ExtMapBuffer3[];
//+------------------------------------------------------------------+
//| Custom indicator initialization function                         |
//+------------------------------------------------------------------+
int init()
  {
   IndicatorShortName("Float Pivot");
//---- indicators
   SetIndexStyle(0, DRAW_LINE);
   SetIndexBuffer(0, ExtMapBuffer1);
   SetIndexLabel(0, "Pivot");
   SetIndexStyle(1, DRAW_LINE);
   SetIndexBuffer(1, ExtMapBuffer2);
   SetIndexLabel(1, "HL1");
   SetIndexStyle(2, DRAW_LINE);
   SetIndexBuffer(2, ExtMapBuffer3);
   SetIndexLabel(2, "HL2");
//---
 IndicatorShortName("FloatPivot(" + IPeriod + ")");

//----
   Comment("FloatPivot(" + IPeriod + ")");
//----
   return(0);
  }
int deinit()
  {
   Comment("");
//----
   return(0);
  }
//+------------------------------------------------------------------+
//| Float Pivot                                                      |
//+------------------------------------------------------------------+
int start()
  {
   int i, counted_bars = IndicatorCounted();
//----
   i = Bars - counted_bars - 1;
   while(i >= 0)
     {
       double max = High[Highest(NULL, 0, MODE_HIGH, IPeriod, i)];
       double min = Low[Lowest(NULL, 0, MODE_LOW, IPeriod, i)];
       double pivot = (Close[i+1] + Close[i+2] + Close[i+3]) / 3;
       // Pivot
       ExtMapBuffer1[i] = (max + min + pivot) / 3;
       // (R1 - Pivot) / 2
       ExtMapBuffer2[i] = ((2*(max + min + pivot) / 3 - min) +
                           (max+min+pivot) / 3) / 2;
       // (Pivot - S1) / 2
       ExtMapBuffer3[i] = ((max + min + pivot) / 3 +
                           (2*(max + min + pivot) / 3 - max)) / 2;
       i--;
     }
//----
   return(0);
  }
//+------------------------------------------------------------------+
Comments