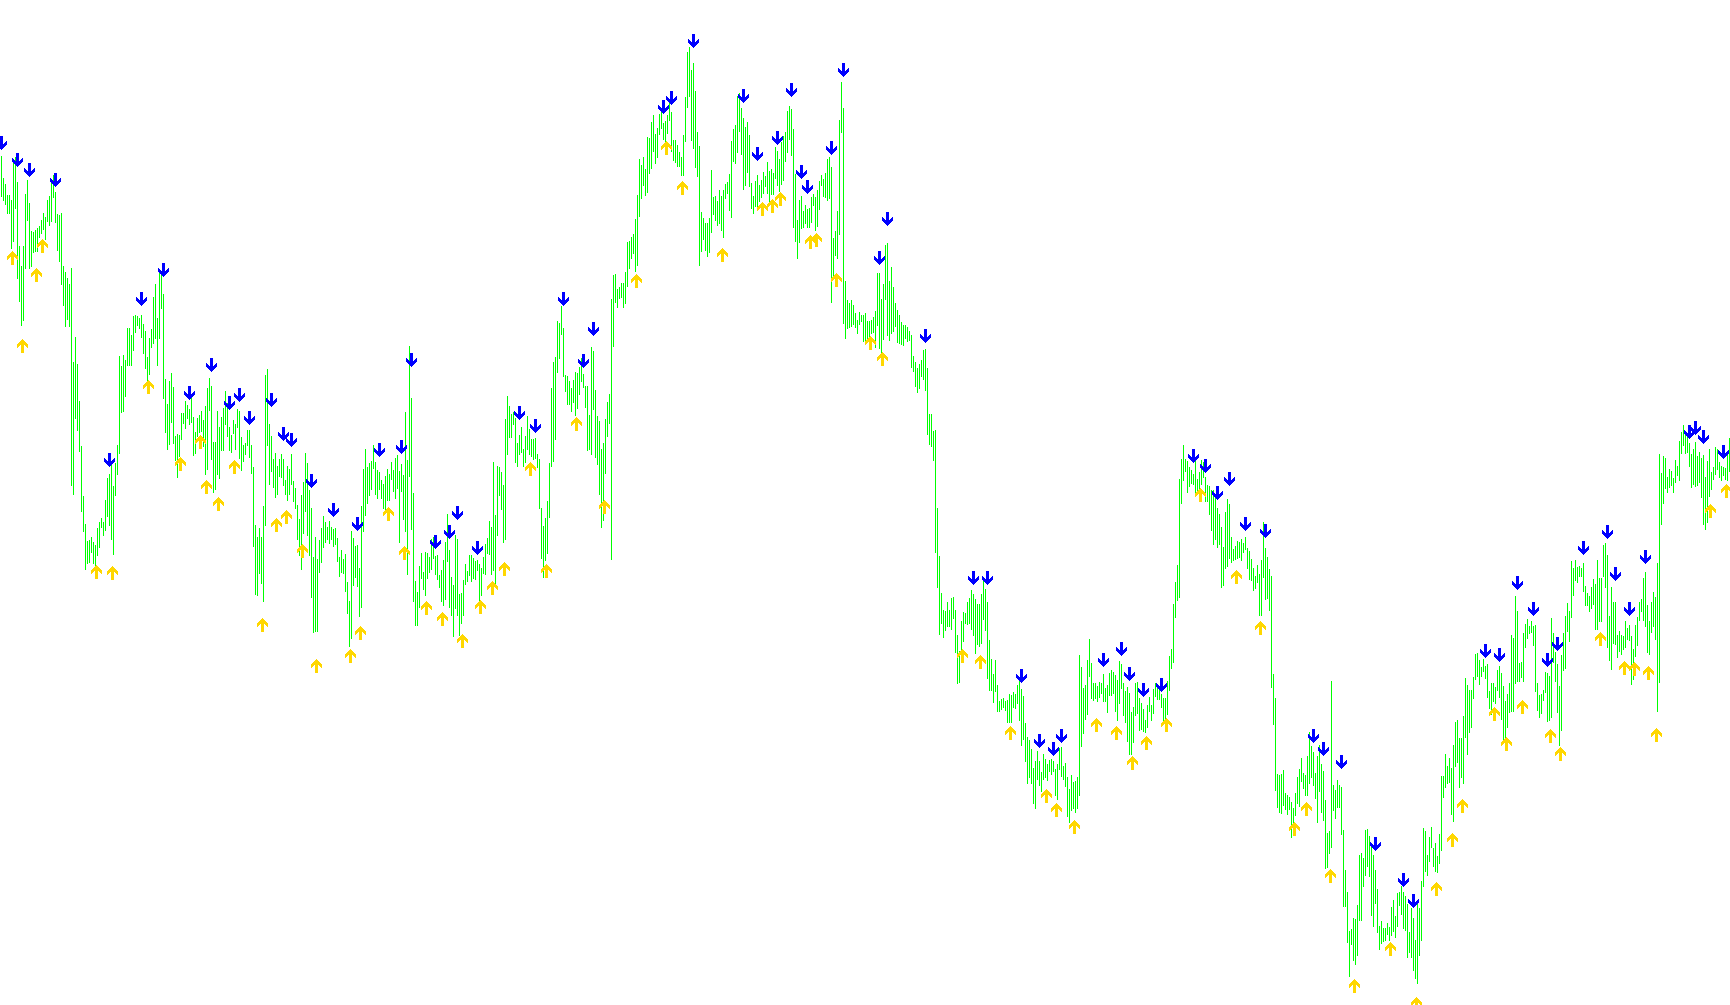
This tool is designed to help traders identify specific momentum shifts in the market by analyzing the relationship between two different types of moving averages. By monitoring how these averages interact with price data, it highlights potential "crossover" moments where the trend might be changing direction.
How the Logic Works
1. Dual Tracking System The script tracks two distinct "Exponential Moving Averages" (EMAs). Unlike a standard average that looks only at one piece of information, this script compares two different types of price points:
- The Fast Tracker: This follows the Closing Price of candles. It reacts more quickly to the most recent market activity.
- The Slow Tracker: This follows the Opening Price of candles. It provides a slightly different perspective on where the price started before moving.
2. Volatility Measurement Before making any decisions, the script calculates the "Range" of the market. It looks at the last 10 bars to determine how much the price is currently swinging (the difference between the highs and the lows). This helps the tool understand the "breathing room" of the market so it can place its visual signals accurately without cluttering the screen.
3. Identifying the Crossover The script constantly scans for a specific three-step sequence where the Fast Tracker crosses over the Slow Tracker. It looks for a "confirmation" pattern:
- Upward Signal: It checks if the Fast Tracker was previously below the Slow Tracker but has now moved above it, while also verifying that the trend continues to move upward in the following data point.
- Downward Signal: Conversely, it looks for the moment the Fast Tracker drops from above the Slow Tracker to below it, confirming a downward shift.
4. Visual Execution When the logic detects these specific crossover points, it places an arrow on your chart:
- Green Arrows appear below the price when a bullish (upward) crossover is detected.
- Red Arrows appear above the price when a bearish (downward) crossover is detected.
By combining the relationship between closing and opening prices with a volatility-based placement system, this script aims to filter out minor noise and highlight significant shifts in market momentum.
//+------------------------------------------------------------------+
//|                                         Ema Open-Close Cross.mq4 |
//|                      Copyright © 2008, MetaQuotes Software Corp. |
//|                                        http://www.metaquotes.net |
//+------------------------------------------------------------------+
#property copyright "Copyright © 2008, MetaQuotes Software Corp."
#property link      "http://www.metaquotes.net"


#property indicator_chart_window
#property indicator_buffers 2
#property indicator_color1 Green
#property indicator_color2 Red

double CrossUp[];
double CrossDown[];
extern int FasterEMA = 5;
extern int SlowerEMA = 5;
//+------------------------------------------------------------------+
//| Custom indicator initialization function                         |
//+------------------------------------------------------------------+
int init()
  {
//---- indicators
   SetIndexStyle(0, DRAW_ARROW, EMPTY);
   SetIndexArrow(0, 233);
   SetIndexBuffer(0, CrossUp);
   SetIndexStyle(1, DRAW_ARROW, EMPTY);
   SetIndexArrow(1, 234);
   SetIndexBuffer(1, CrossDown);
//----
   return(0);
  }
//+------------------------------------------------------------------+
//| Custom indicator deinitialization function                       |
//+------------------------------------------------------------------+
int deinit()
  {
//----

//----
   return(0);
  }
//+------------------------------------------------------------------+
//| Custom indicator iteration function                              |
//+------------------------------------------------------------------+
int start() {
   int limit, i, counter;
   double fasterEMAnow, slowerEMAnow, fasterEMAprevious, slowerEMAprevious, fasterEMAafter, slowerEMAafter;
   double Range, AvgRange;
   int counted_bars=IndicatorCounted();
//---- check for possible errors
   if(counted_bars<0) return(-1);
//---- last counted bar will be recounted
   if(counted_bars>0) counted_bars--;

   limit=Bars-counted_bars;

   for(i = 0; i <= limit; i++) {

      counter=i;
      Range=0;
      AvgRange=0;
      for (counter=i ;counter<=i+9;counter++)
      {
         AvgRange=AvgRange+MathAbs(High[counter]-Low[counter]);
      }
      Range=AvgRange/10;

      fasterEMAnow = iMA(NULL, 0, FasterEMA, 0, MODE_EMA, PRICE_CLOSE, i);
      fasterEMAprevious = iMA(NULL, 0, FasterEMA, 0, MODE_EMA, PRICE_CLOSE, i+1);
      fasterEMAafter = iMA(NULL, 0, FasterEMA, 0, MODE_EMA, PRICE_CLOSE, i-1);

      slowerEMAnow = iMA(NULL, 0, SlowerEMA, 0, MODE_EMA, PRICE_OPEN, i);
      slowerEMAprevious = iMA(NULL, 0, SlowerEMA, 0, MODE_EMA, PRICE_OPEN, i+1);
      slowerEMAafter = iMA(NULL, 0, SlowerEMA, 0, MODE_EMA, PRICE_OPEN, i-1);

      if ((fasterEMAnow > slowerEMAnow) && (fasterEMAprevious < slowerEMAprevious) && (fasterEMAafter > slowerEMAafter)) {
         CrossUp[i] = Low[i] - Range*0.5;
      }
      else if ((fasterEMAnow < slowerEMAnow) && (fasterEMAprevious > slowerEMAprevious) && (fasterEMAafter < slowerEMAafter)) {
         CrossDown[i] = High[i] + Range*0.5;
      }
   }
   return(0);
}
Comments