EMA_Trend_Indicator_v1
Download script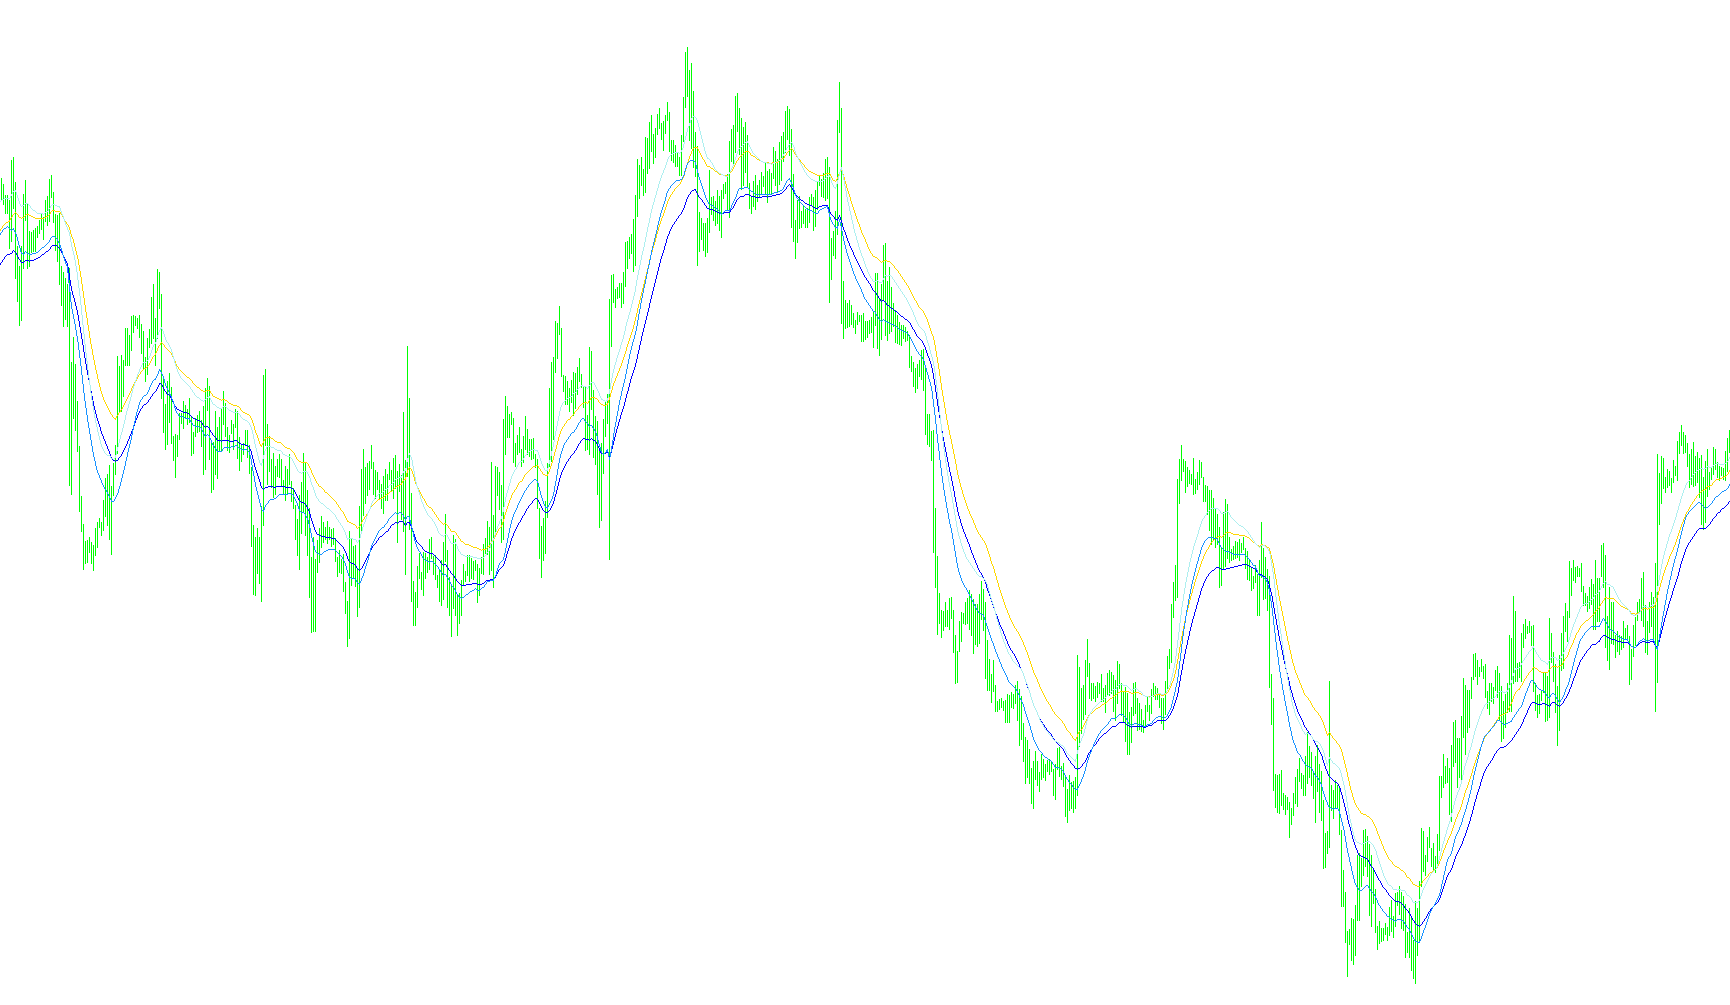
The EMA Trend Indicator is a technical analysis tool designed to help traders visualize and identify the prevailing direction of the market by smoothing out price fluctuations. Instead of looking at raw, erratic price movements, this script analyzes specific price data points to provide a clearer picture of the market's momentum.
How it Works
The logic behind this indicator relies on two different "speeds" of moving averages, categorized as Fast and Slow. These moving averages act like filters: they calculate an average price over a specific number of past candles (periods), giving more weight to recent data to ensure the indicator responds quickly to new information while ignoring minor "noise."
To provide a comprehensive view of the market trend, the script tracks four distinct data points simultaneously:
- Fast High Average: Tracks the recent highs at a faster speed.
- Fast Low Average: Tracks the recent lows at a faster speed.
- Slow High Average: Tracks the recent highs at a broader, slower pace.
- Slow Low Average: Tracks the recent lows at a broader, slower pace.
Key Features and Visualization
- Trend Detection: By comparing the "Fast" averages against the "Slow" averages, traders can observe how quickly the current price action is moving relative to the long-term history. When these lines move in different directions or cross each other, it often signals a potential shift in market sentiment.
- High/Low Tracking: Unlike standard indicators that only look at where the market closes, this script specifically monitors the "Highs" and "Lows." This provides a wider "envelope" of price action, helping to define the upper and lower boundaries of a trend.
- Visual Clarity: The indicator renders four distinct lines on your chart. By separating these into different colors and widths, it allows you to visually distinguish between short-term volatility (the Fast lines) and the overarching market structure (the Slow lines).
Summary for Traders
This tool is intended to simplify market analysis by filtering out insignificant price ripples. By observing the relationship between the fast-moving and slow-moving averages of both the high and low prices, you can better identify whether the market is trending upward, downward, or moving sideways, allowing for more informed entry and exit decisions.
/*-----------------------------+
|			       |
| Shared by www.Aptrafx.com    |
|			       |
+------------------------------*/

//+------------------------------------------------------------------+
//|                                          EMA_Trend_Indicator.mq4 |
//|                                Copyright © 2006, Robert L Hill   |
//+------------------------------------------------------------------+
// Uses an idea from david to use EMAs to determine trend
#property copyright "Copyright © 2005, Metaquotes"
#property link      "mailto:metaquotes@metaquotes.net"

#property indicator_chart_window
#property indicator_buffers 4
#property indicator_color1 Yellow
#property indicator_color2 Purple
#property indicator_color3 Purple
#property indicator_color4 Yellow
#property indicator_width1 2
#property indicator_width2 2
#property indicator_width3 2
#property indicator_width4 2

//---- input parameters
extern int FastMAPeriod=21;
extern int SlowMAPeriod=34;

//---- buffers
double fastEMA_HighBuffer[];
double fastEMA_LowBuffer[];
double slowEMA_HighBuffer[];
double slowEMA_LowBuffer[];
//---- variables

//+------------------------------------------------------------------+
//| Custom indicator initialization function                         |
//+------------------------------------------------------------------+
int init()
{
   IndicatorDigits(MarketInfo(Symbol(),MODE_DIGITS)+1);
   //---- indicators
   SetIndexStyle(0,DRAW_LINE);
   SetIndexBuffer(0,slowEMA_HighBuffer);
   SetIndexStyle(1,DRAW_LINE);
   SetIndexBuffer(1,slowEMA_LowBuffer);
   SetIndexStyle(2,DRAW_LINE);
   SetIndexBuffer(2,fastEMA_HighBuffer);
   SetIndexStyle(3,DRAW_LINE);
   SetIndexBuffer(3,fastEMA_LowBuffer);
   SetIndexDrawBegin(0,SlowMAPeriod);
   //---- name for DataWindow and indicator subwindow label
   IndicatorShortName("MA Trend ");
   //----
   return(0);
}
//+------------------------------------------------------------------+
//| Custor indicator deinitialization function                       |
//+------------------------------------------------------------------+
int deinit()
{
   //----

   //----
   return(0);
}


//+------------------------------------------------------------------+
//| Custom indicator iteration function                              |
//+------------------------------------------------------------------+
int start()
{
   int limit;
   int counted_bars = IndicatorCounted();
   //---- check for possible errors
   if (counted_bars<0) return(-1);
   //---- last counted bar will be recounted
   if (counted_bars>0) counted_bars--;
   limit = Bars - counted_bars;

   for(int i=limit; i>=0; i--)
   {
     fastEMA_HighBuffer[i] = iMA(NULL,0,FastMAPeriod,0,MODE_EMA,PRICE_HIGH,i);
     fastEMA_LowBuffer[i] = iMA(NULL,0,FastMAPeriod,0,MODE_EMA,PRICE_LOW,i);
     slowEMA_HighBuffer[i] = iMA(NULL,0,SlowMAPeriod,0,MODE_EMA,PRICE_HIGH,i);
     slowEMA_LowBuffer[i] = iMA(NULL,0,SlowMAPeriod,0,MODE_EMA,PRICE_LOW,i);
   }

   //----
   return(0);
}
//+------------------------------------------------------------------+
Comments