EMAOsMA_v1
Download script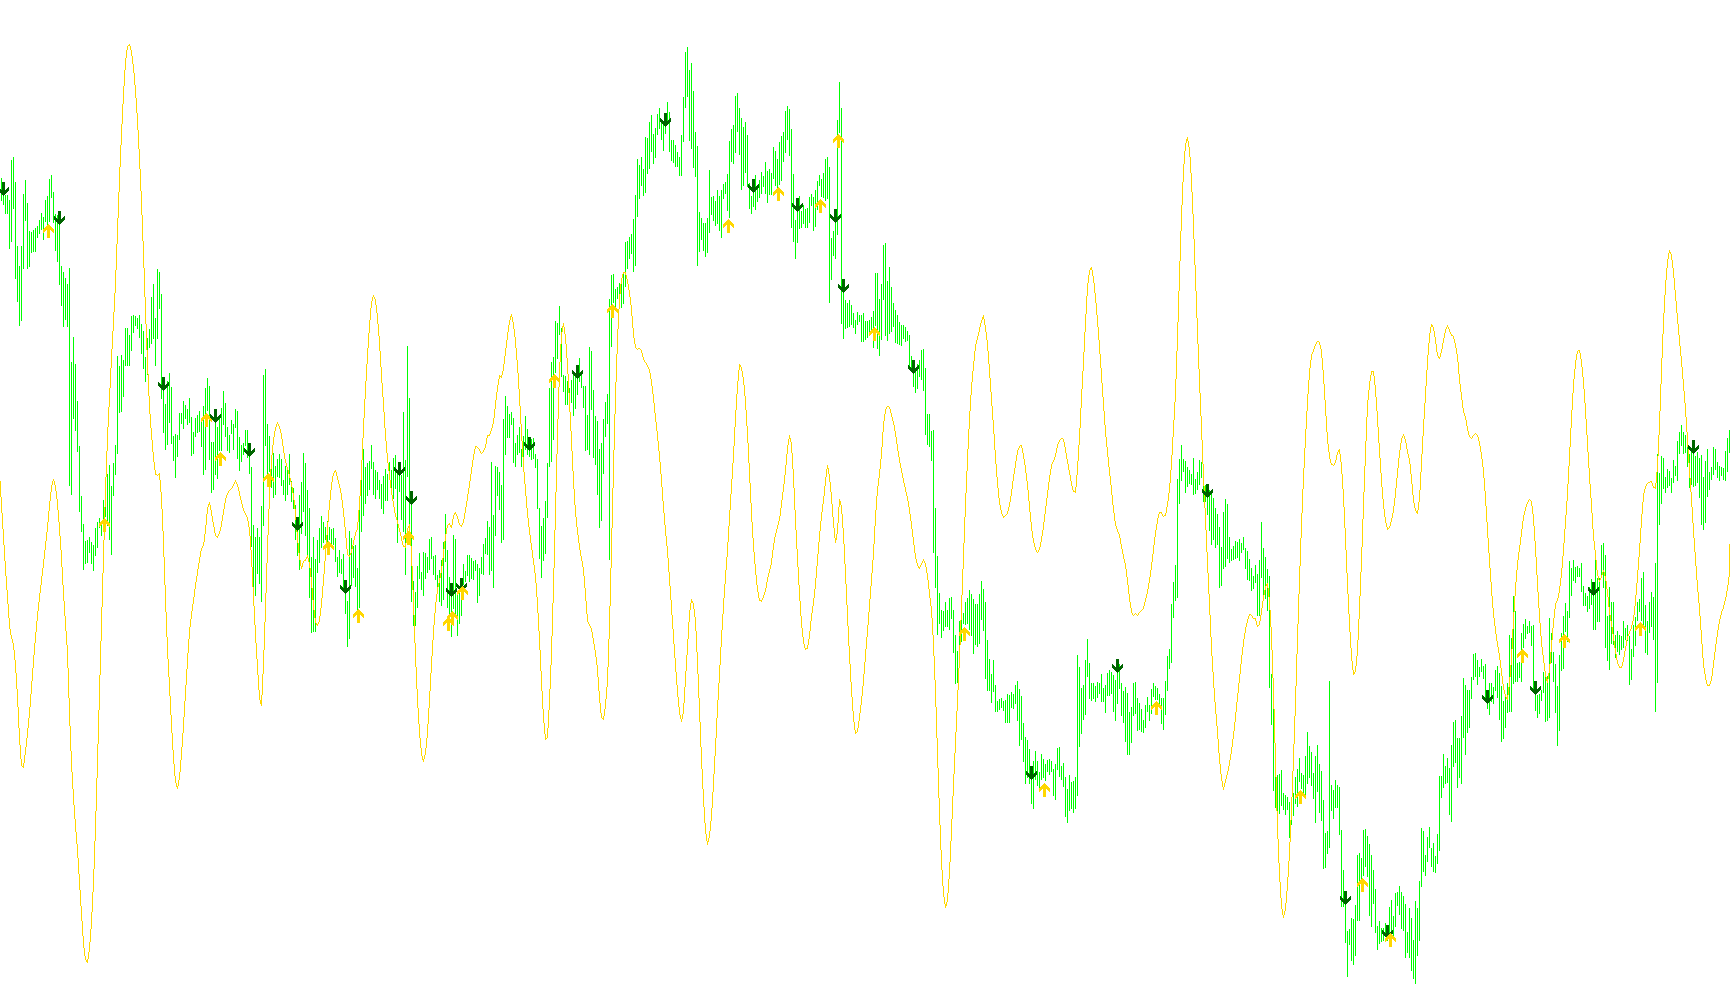
This technical script is designed as a specialized trading indicator for the MetaTrader platform. Its primary purpose is to analyze market momentum by combining multiple moving average calculations to identify specific turning points in price action, which are then signaled to the user through visual markers on the chart.
Core Logic and Mechanics
Data Processing & Smoothing The script functions by processing historical price data through two distinct layers of calculation:
- Initial Calculation: It first gathers a base set of data using a specific moving average formula (based on parameters of 10, 26, and 9). This creates a preliminary "map" of the market's direction.
- Secondary Smoothing: The script then takes that map and applies an Exponential Moving Average (EMA) to it. By layering one moving average over another, the tool filters out "market noise"—the small, insignificant price fluctuations—to reveal the larger, underlying trend more clearly.
Trend Detection The primary logic relies on detecting a transition from negative to positive values (and vice versa) within this processed data. Because the script looks at these calculated values in relation to their previous positions, it is designed to pinpoint the exact moment a trend shifts or reverses.
Visual Signaling When the logic detects a significant shift in the data trend, the script automatically places visual markers (arrows) on the trading chart:
- Bullish Signal: When the calculated value crosses from below zero to above zero, a gold arrow appears near the bottom of the price candle, suggesting upward momentum.
- Bearish Signal: When the calculated value crosses from above zero to below zero, a dark green arrow appears near the top of the price candle, suggesting downward momentum.
User Experience
From a practical standpoint, this script automates the complex math required to "smooth" market data. Instead of requiring a trader to manually interpret multiple overlapping lines, it handles those calculations in the background and provides clear, color-coded visual cues at the specific moments where the trend changes direction. The tool also includes automated cleanup routines to ensure that the chart remains clean by managing how these visual objects are drawn and updated.
/*-----------------------------+
|			       |
| Shared by www.Aptrafx.com    |
|			       |
+------------------------------*/

//+------------------------------------------------------------------+
//|                                                      EMAOsMA.mq4 |
//|                                                         Mohammed |
//|                                         http://www.forex-tsd.com |
//+------------------------------------------------------------------+

#property copyright "Mohammed"
#property link      "http://www.forex-tsd.com"

#property indicator_separate_window
#property indicator_buffers 1
#property indicator_color1 Red

extern int EmaPeriod = 12;


extern color UpCross = Gold;
extern color DownCross = DarkGreen;
extern int ArrowCode1 = 233;
extern int ArrowCode2 = 234;

//---- buffers
double ExtMapBuffer1[];


//+------------------------------------------------------------------+
//| Custom indicator initialization function                         |
//+------------------------------------------------------------------+
int init()
  {
//---- indicators
   IndicatorDigits(MarketInfo(Symbol(),MODE_DIGITS)+2);

   SetIndexStyle(0,DRAW_LINE);
   SetIndexBuffer(0,ExtMapBuffer1);

   int I = WindowsTotal();
   for (int count = 0; count < WindowsTotal(); count++)
   {
      int nObjects = ObjectsTotal();
      for (int i=nObjects; i>=0; i--)
      {
         string objName = ObjectName(i);
         if(StringFind(objName, "acustom", 0) >= 0)
         ObjectDelete(objName);
      }
   }
//----
   return(0);
  }
//+------------------------------------------------------------------+
//| Custom indicator deinitialization function                       |
//+------------------------------------------------------------------+
int deinit()
  {
int I = WindowsTotal();
   for (int count = 0; count < WindowsTotal(); count++)
   {
      int nObjects = ObjectsTotal();
      for (int i=nObjects; i>=0; i--)
      {
         string objName = ObjectName(i);
         if(StringFind(objName, "acustom", 0) >= 0)
         ObjectDelete(objName);
      }
   }
   return(0);
  }

  void DrawArrow( int bar , double value , int trend)
   {

      static int cnt = 0;
      cnt++;
      string crossing = "acustom_" + cnt;

      ObjectCreate(crossing, OBJ_ARROW, 0, Time[bar], value);


      if(trend == 1)
      {
         ObjectSet(crossing, OBJPROP_ARROWCODE, ArrowCode1);
         ObjectSet(crossing, OBJPROP_COLOR , UpCross);
      }

      if(trend == 2)
      {
         ObjectSet(crossing, OBJPROP_ARROWCODE, ArrowCode2);
         ObjectSet(crossing, OBJPROP_COLOR , DownCross);

      }

      ObjectSet(crossing, OBJPROP_WIDTH  , 1);
      ObjectsRedraw();
   }
//+------------------------------------------------------------------+
//| Custom indicator iteration function                              |
//+------------------------------------------------------------------+
int start()
  {

   int i, limit;

   int counted_bars=IndicatorCounted();
   if(counted_bars<0) return(-1);
   if(counted_bars>0) counted_bars--;
   limit=Bars-IndicatorCounted();


   double marray[];

   ArrayResize( marray, limit);
   ArraySetAsSeries(marray,true);

   for(i=0; i<limit; i++)
   {
      marray[i] = iOsMA(NULL,0,10,26,9,PRICE_CLOSE,i);
      ExtMapBuffer1[i]=marray[i];
   }
   for(i=0; i<limit; i++)
   {
         ExtMapBuffer1[i]=iMAOnArray(marray,limit,EmaPeriod,0,MODE_EMA,i);
   }

   while (limit>0)
   {
      if (ExtMapBuffer1[limit] > 0 && ExtMapBuffer1[limit+1] < 0)
      DrawArrow (limit , Low[limit] - 1 * Point , 1);

      if (ExtMapBuffer1[limit] < 0 && ExtMapBuffer1[limit+1] > 0)
      DrawArrow (limit , High[limit] + 5 * Point , 2);

      limit--;

   }


//----
   return(0);
  }
//+------------------------------------------------------------------+
Comments