Okay, here's a breakdown of what this MetaTrader script does, explained in a way that someone without programming knowledge can understand:
Overall Goal:
This script is designed to identify potential buy or sell signals in a financial market by analyzing price data and applying a combination of technical indicators. It aims to spot moments when the market might be about to change direction.
Core Concepts:
-
Indicators: The script uses several mathematical calculations (called indicators) based on historical price data. These indicators are like specialized tools that help traders understand the market's momentum and potential turning points. The primary indicators used are:
- CCI (Commodity Channel Index): An indicator that measures the current price level relative to an average price level over a period of time. It helps identify when an asset is overbought or oversold.
- EWO (Elliot Wave Oscillator): This is calculated by subtracting a long-term moving average from a short-term moving average. The script uses moving averages of 5 and 34 periods. It is a type of momentum indicator.
-
Timeframes: The script analyzes price data over different time periods (e.g., hourly, daily). This allows the script to identify trends at different scales.
-
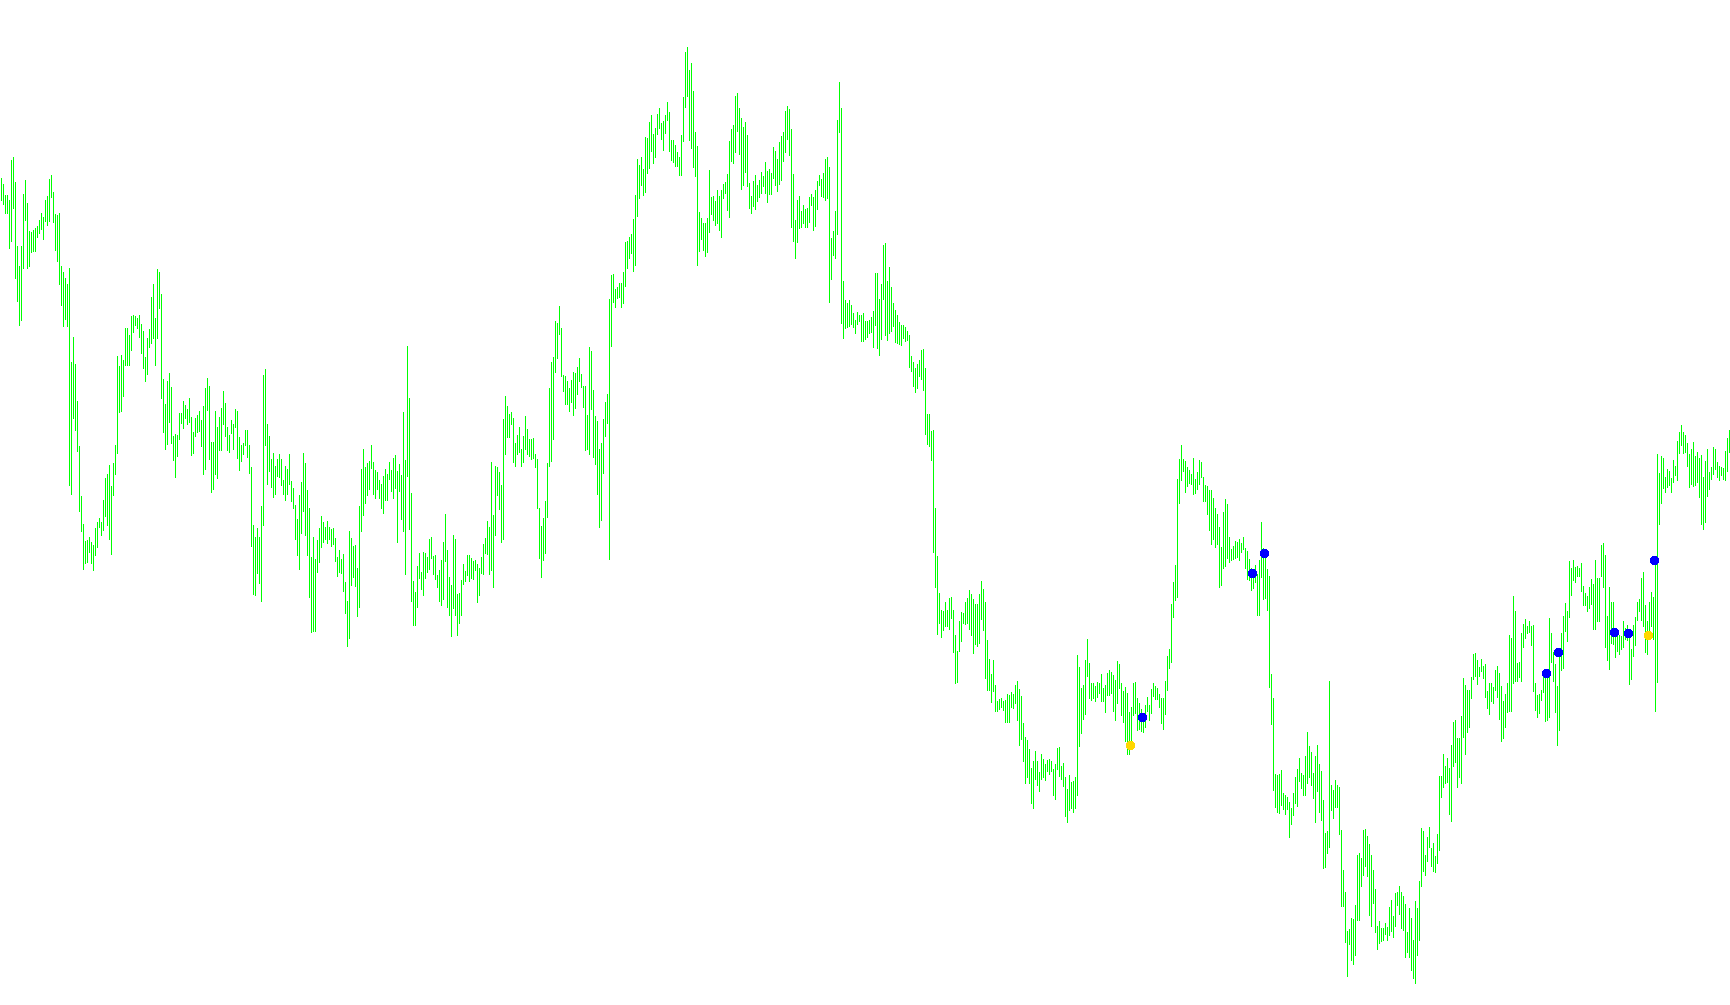
Buy and Sell Signals: The script's main function is to generate visual buy and sell signals on the chart based on the calculated indicators. When certain conditions are met (specific indicator values and relationships), an arrow appears on the chart indicating a potential trading opportunity.
How it Works (Step-by-Step):
-
Setup:
- The script starts by defining customizable settings (input parameters) like:
smoothing: A setting related to the smoothing of an underlying calculation (likely within the indicators).timeframe: Specifies the timeframe to use (e.g., 1-hour chart, daily chart).A_t3_period: A period setting related to the T3 calculation (likely within the indicators).num_barsandCountBars: The number of past data points (bars) on the chart that the script will analyze.UseAlert: A setting to enable or disable pop-up alerts.SignalCandle: Specifies which candle to use for signal calculation.
- The script starts by defining customizable settings (input parameters) like:
-
Data Collection:
- The script then gathers historical price data (open, high, low, close prices) for the specified timeframe and the number of bars defined.
- It fetches the close price of the last closed candle on the hourly timeframe (PERIOD_H1).
- It fetches the close price of the candle indicated by the SignalCandle input on the daily timeframe (PERIOD_D1).
- It also calculates a pivot point value, which is the average of the previous day's high, low, and close prices.
-
Indicator Calculation:
- The script calculates the CCI and EWO indicators.
-
Signal Generation:
- The core logic lies in the
ifstatements. It checks if certain conditions related to the CCI and EWO values are met. For example, it looks for moments when:- CCI crosses above 0 from below in combination with the EWO being positive. This is a bullish scenario (potential buy signal).
- CCI crosses below 0 from above in combination with the EWO being negative. This is a bearish scenario (potential sell signal).
- The core logic lies in the
-
Visual Alerts:
- If the conditions for a buy or sell signal are met:
- The script draws an arrow on the chart at the corresponding price point (low for a buy, high for a sell).
- If alerts are enabled (
UseAlert=True), a pop-up window appears with a message indicating the signal (e.g., "EWOCCI cross UP.").
- If the conditions for a buy or sell signal are met:
In Simple Terms:
Imagine the script as a weather forecaster for the financial markets. It uses different weather instruments (the indicators) to analyze market conditions. When the instruments indicate a specific type of weather pattern (a combination of indicator values), the script raises a flag (a buy or sell signal) to warn you about a potential change in the market's direction.
//+---------------------------------------------------------+
//| T3 Trix crossing  signals.mq4
//|
//| Perky..(Based on xxDavidxSxx's Ewocci Method)
//+------------------------------------------------------------------+
#property  copyright "Author - Perky Aint no Porky"

#property indicator_chart_window
#property indicator_buffers 2
#property indicator_color1 LightBlue
#property indicator_width1 3
#property indicator_color2 Red
#property indicator_width2 3

//---- input parameters
extern int smoothing=13;
extern int  timeframe=0;
extern int       A_t3_period=18;
extern int       num_bars=350;

extern int CountBars=350;
extern bool UseAlert=True;
extern bool SignalCandle=1;

//---- buffers
double val1[];
double val2[];
double CCI,CCIb4;
double EWO;
 double MA5,MA34;
int Timer;
string UD="";
double PrevPrice;
double PrevHigh  ;
double PrevLow  ;
double P  ;
double Price;

//+------------------------------------------------------------------+
//| Custom indicator initialization function                         |
//+------------------------------------------------------------------+
int init()
  {
   string short_name;
//---- indicator line
   IndicatorBuffers(2);
   SetIndexStyle(0,DRAW_ARROW);
   SetIndexArrow(0,108);
   SetIndexStyle(1,DRAW_ARROW);
   SetIndexArrow(1,108);
   SetIndexBuffer(0,val1);
   SetIndexBuffer(1,val2);
//----
   return(0);
  }
//+------------------------------------------------------------------+
//| AltrTrend_Signal_v2_2                                            |
//+------------------------------------------------------------------+
int start()
  {
  // if (CountBars>=500) CountBars=500;
  // SetIndexDrawBegin(0,500-CountBars);
  // SetIndexDrawBegin(1,500-CountBars);
  int i,shift,counted_bars=IndicatorCounted();


   //---- check for possible errors
  // if(counted_bars<0) return(-1);

   //---- initial zero
  // if(counted_bars<1)
   //  {
    //  for(i=1;i<=CountBars;i++) val1[CountBars-i]=0.0;
    //  for(i=1;i<=CountBars;i++) val2[CountBars-i]=0.0;
    // }

for ( shift = CountBars; shift>=0; shift--)
{
      PrevPrice = iClose(NULL,PERIOD_D1,SignalCandle);
      PrevHigh  = iHigh(NULL,PERIOD_D1,SignalCandle);
      PrevLow   = iLow(NULL,PERIOD_D1,SignalCandle);
      P = (PrevHigh + PrevLow + PrevPrice)/3;
      Price = iClose(NULL,PERIOD_H1,1); //gets close of last closed candle


    CCI =iCCI(NULL,0,55,PRICE_CLOSE,SignalCandle+shift);
    CCIb4=iCCI(NULL,0,55,PRICE_CLOSE,SignalCandle+shift+1);
    //Elliot Wave
    MA5=iMA(NULL,0,5,0,MODE_SMA,PRICE_MEDIAN,SignalCandle+shift);
    MA34=iMA(NULL,0,34,0,MODE_SMA,PRICE_MEDIAN,SignalCandle+shift);
    EWO=MA5-MA34;  // yes thats it - Elliot Wave
//Comment ( "mtfstochs=",mtfstochs,"mtfstochsb4=",mtfstochsb4,"\nmtfstochs1=",mtfstochs1,"mtfstochs1b4=",mtfstochs1b4);
 	   val1[shift]=0;
		val2[shift]=0;

if(ObjectFind("P label") != 0)
      {
      ObjectCreate("P label", OBJ_TEXT, 0, Time[20], P);
      ObjectSetText("P label", "Pivot", 8, "Arial", Orange);
      }
       if(ObjectFind("P line") != 0)
      {
      ObjectCreate("P line", OBJ_HLINE, 0, Time[40], P);
      ObjectSet("P line", OBJPROP_STYLE, STYLE_DOT);
      ObjectSet("P line", OBJPROP_COLOR, Orange);
      }
//if ( TTb4>TT1b4 && TT<TT1 )

 if ( CCI>=0 && CCIb4<0 &&   EWO>0)

{
		val1[shift]=Low[shift]-8*Point;

	if (shift < 2 )

	{
	   UD=" UP.";
		DoAlert(UD);
	}

}
// if ( TTb4<TT1b4 && TT>TT1)
 if ( CCI<=0 && CCIb4> 0 &&  EWO<0)
{
	val2[shift]=High[shift]+8*Point;


	 if (shift < 2 )
  {
  UD=" DOWN.";
  DoAlert(UD);
  }
}


}
   //return(0);
  }

void DoAlert(string UD)
{
   if (!NewBar() || !UseAlert)
      return;
     Alert (Symbol()," ",Period()," EWOCCI cross ",UD);

}


  bool NewBar()
{
   static datetime dt  = 0;
   if (dt != Time[0])
   {
      dt = Time[0];
      return(true);
   }

}

//+------------------------------------------------------------------+
Comments