t3-TRIX signals1
Download script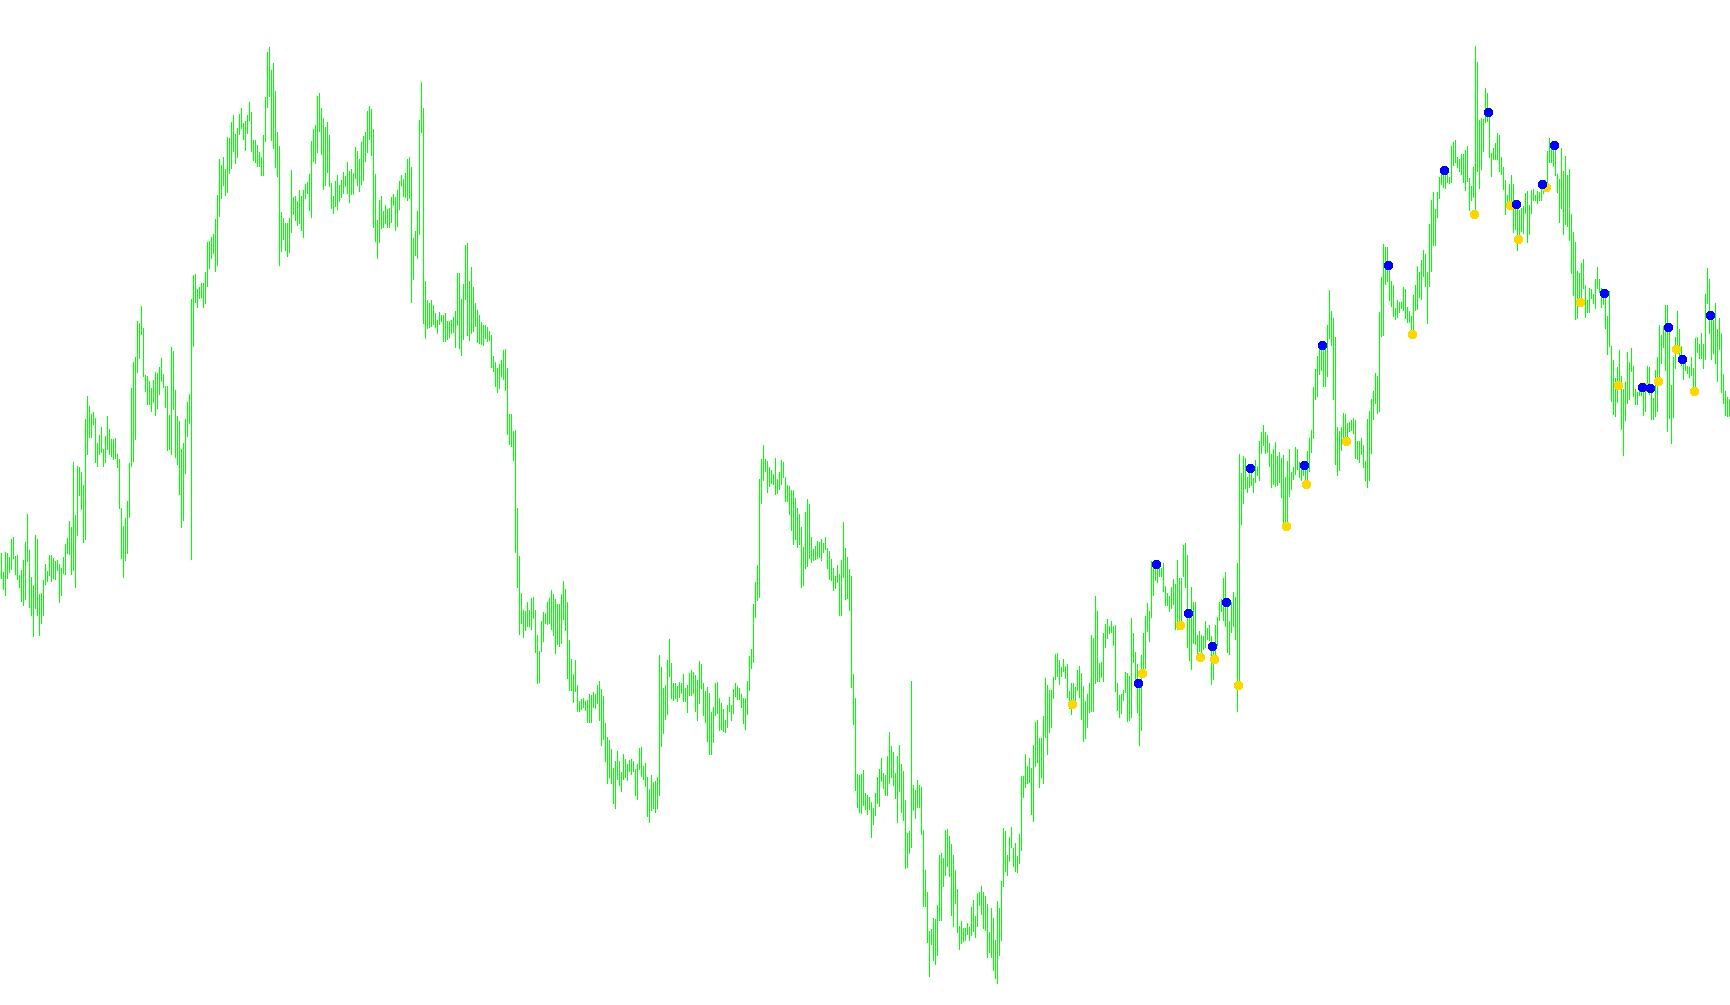
This tool is designed as a visual trading assistant that identifies specific momentum shifts in the financial market by monitoring the interaction between two distinct technical indicators. Its primary purpose is to filter out market noise and pinpoint moments where the price trend may be changing direction, signaling potential "Up" or "Down" opportunities.
How the Logic Works
The script functions by analyzing a specialized set of calculations known as the "T3 Trix." Instead of looking at just one data point, it compares two different versions of this indicator simultaneously to detect "crosses"—moments when one line moves past another.
1. Data Monitoring The tool continuously scans historical price data over a user-defined period (the number of bars). It looks specifically for the relationship between two primary components:
- Component A: A primary trend line derived from the T3 Trix calculation.
- Component B: A secondary, slightly different variation of the same calculation.
2. Identifying the Signals The logic triggers a signal only when a specific "crossover" occurs between these two components. It looks for a transition where the relative positions of these lines flip from one candle to the next:
- Bullish Signal (UP): The tool detects a move where the primary trend values cross in a way that suggests upward momentum is gaining strength. When this condition is met, the script places a visual marker (an arrow) below the current price.
- Bearish Signal (DOWN): Conversely, it monitors for a downward crossover where the indicators suggest a loss of upward steam or a shift toward a decline. When this occurs, the script places a visual marker (an arrow) above the current price.
3. Alerts and Notifications To ensure that traders do not have to watch the charts constantly, the script includes an integrated notification system. Whenever a new signal is generated on a live candle:
- It verifies that it is a new time period (to avoid repeating the same alert).
- It triggers a pop-up alert on the trading platform, clearly stating whether the detected cross is "UP" or "DOWN."
Summary for the User
In simple terms, this script acts as a "scanner." It watches two mathematical trends behind the scenes; when those trends collide and swap positions, it highlights the event on your chart with an arrow and sends you an immediate notification so you can react to the potential trend change in real-time.
/*-----------------------------+
|			       |
| Shared by www.Aptrafx.com    |
|			       |
+------------------------------*/

//+---------------------------------------------------------+
//| T3 Trix crossing  signals.mq4
//|
//| Perky..
//+------------------------------------------------------------------+
#property  copyright "Author - Perky Aint no Porky"

#property indicator_chart_window
#property indicator_buffers 2
#property indicator_color1 LightBlue
#property indicator_width1 3
#property indicator_color2 Red
#property indicator_width2 3

//---- input parameters

extern int       A_t3_period=18;
extern int       num_bars=350;
extern int       is_A_open_price=0;
extern int       B_t3_period_ac=10;
extern int       diferential=0;
extern double    hot=0.7;
extern int CountBars=350;
extern bool UseAlert=True;

//---- buffers
double val1[];
double val2[];
double mtfstochs,mtfstochsb4;
double mtfstochs1,mtfstochs1b4;
int Timer;
string UD="";
//+------------------------------------------------------------------+
//| Custom indicator initialization function                         |
//+------------------------------------------------------------------+
int init()
  {
   string short_name;
//---- indicator line
   IndicatorBuffers(2);
   SetIndexStyle(0,DRAW_ARROW);
   SetIndexArrow(0,108);
   SetIndexStyle(1,DRAW_ARROW);
   SetIndexArrow(1,108);
   SetIndexBuffer(0,val1);
   SetIndexBuffer(1,val2);
//----
   return(0);
  }
//+------------------------------------------------------------------+
//| AltrTrend_Signal_v2_2                                            |
//+------------------------------------------------------------------+
int start()
  {
  // if (CountBars>=500) CountBars=500;
  // SetIndexDrawBegin(0,500-CountBars);
  // SetIndexDrawBegin(1,500-CountBars);
  int i,shift,counted_bars=IndicatorCounted();


   //---- check for possible errors
  // if(counted_bars<0) return(-1);

   //---- initial zero
  // if(counted_bars<1)
   //  {
    //  for(i=1;i<=CountBars;i++) val1[CountBars-i]=0.0;
    //  for(i=1;i<=CountBars;i++) val2[CountBars-i]=0.0;
    // }

for ( shift = CountBars; shift>=0; shift--)
{


     mtfstochs=
     iCustom(Symbol(),Period(),"T3 -trix",A_t3_period,num_bars,is_A_open_price,B_t3_period_ac,diferential,hot,0,shift+0);
     mtfstochsb4=
     iCustom(Symbol(),Period(),"T3 -trix",A_t3_period,num_bars,is_A_open_price,B_t3_period_ac,diferential,hot,0,shift+1);

     mtfstochs1=
          iCustom(Symbol(),Period(),"T3 -trix",A_t3_period,num_bars,is_A_open_price,B_t3_period_ac,diferential,hot,1,shift+0);

     mtfstochs1b4=
         iCustom(Symbol(),Period(),"T3 -trix",A_t3_period,num_bars,is_A_open_price,B_t3_period_ac,diferential,hot,1,shift+1);

//Comment ( "mtfstochs=",mtfstochs,"mtfstochsb4=",mtfstochsb4,"\nmtfstochs1=",mtfstochs1,"mtfstochs1b4=",mtfstochs1b4);
 	   val1[shift]=0;
		val2[shift]=0;

//if ( TTb4>TT1b4 && TT<TT1 )
 if ( mtfstochsb4<mtfstochs1b4 && mtfstochs>mtfstochs1)

{
	val2[shift]=High[shift]+8*Point;
	if (shift < 2 )

	{
	   UD="DOWN.";
		DoAlert(UD);
	}

}
// if ( TTb4<TT1b4 && TT>TT1)
if  (mtfstochsb4>mtfstochs1b4 && mtfstochs<mtfstochs1)

{
		val1[shift]=Low[shift]-8*Point;

	 if (shift < 2 )
  {
  UD=" UP.";
  DoAlert(UD);
  }
}


}
   //return(0);
  }

void DoAlert(string UD)
{
   if (!NewBar() || !UseAlert)
      return;
     Alert (Symbol()," ",Period(),"T3 TRIX cross ",UD);

}


  bool NewBar()
{
   static datetime dt  = 0;
   if (dt != Time[0])
   {
      dt = Time[0];
      return(true);
   }

}

//+------------------------------------------------------------------+
Comments